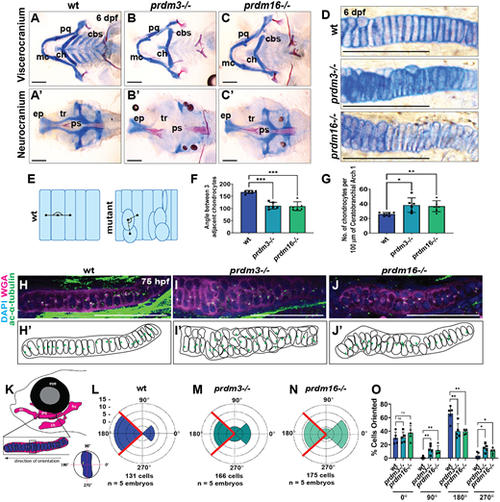
prdm3 and prdm16 are necessary for chondrocyte stacking and polarity in the zebrafish craniofacial skeleton. (A-G) Wild-type (wt), prdm3−/− and prdm16−/− zebrafish embryos were collected at 6 dpf and stained with Alcian Blue and Alizarin Red. (A-D) Images of dissected and flat-mounted viscerocranium (A-C) and neurocranium (A′-C′), and high magnification of chondrocytes (D). cbs, ceratobranchials; ch, ceratohyal; ep, ethmoid plate; mc, Meckel's cartilage; pq, palatoquadrate; ps, parasphenoid; tr, trabeculae. Scale bars: 100 µm. (E,F) Quantification of chondrocyte organization (F) as schematized in E (n=6 per genotype); mean±s.d. Black lines in E indicate angle measurement between adjacent chondrocytes. (G) Quantification of the number of chondrocytes per 100 µm of tissue (n=6 per genotype); mean±s.d. (H-O) Wild-type, prdm3−/− or prdm16−/− larvae were immunostained with acetylated α-tubulin to label MTOCs, denoting directional growth, and counterstained with DAPI and wheat germ agglutinin (WGA) at 75 hpf (H-J). Shown are lateral high-magnification views of the palatoquadrate. Scale bars: 50 µm. (H′-J′) Schematics showing misoriented chondrocytes. Green dots represent the localization of acetylated α-tubulin puncta. (K-O) Quantification of chondrocyte polarity (positioning of acetylated α-tubulin puncta), as depicted in K for wild type (L), prdm3−/− (M) and prdm16−/− (N). (O) Percentage of cells in each indicated quadrant normalized to the total number of cells for each genotype. (n=5 per genotype); mean±s.d. *P≤0.05, **P≤0.005, ***P≤0.001; ns, not significant (unpaired, two-tailed Student's t-test).
|
