
- Title
-
Impaired leptin signaling causes subfertility in female zebrafish
- Authors
- Tsakoumis, E., Ahi, E.P., Schmitz, M.
- Source
- Full text @ Mol. Cell. Endocrinol.
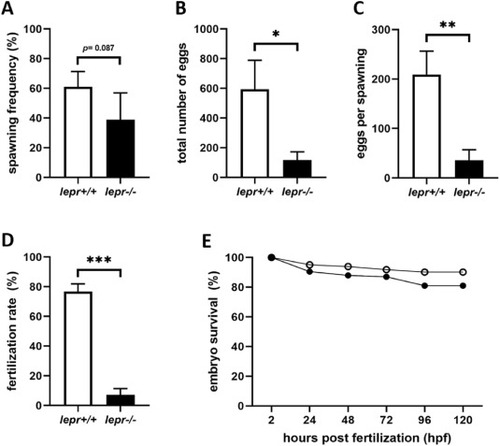
Fig. 1. Fertility assessment of wild-type and lepr mutant female zebrafish. Spawning frequency (A), total number of eggs spawned (B), number of eggs per spawning event (C), fertilization rate (D) and embryo survival (E) from couples of wild-type (lepr+/+) males and females (empty bars or circles) and wild-type (lepr+/+) males with mutant (lepr−/−) females (filled bars or circles). Data shown as means ± SE (n = 6). Significant differences between different groups are indicated by *p < 0.05, **p < 0.01, ***p < 0.001. PHENOTYPE:
|
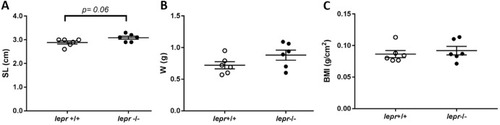
Fig. 2. Standard length (A), body weight (B) and body mass index (C) of lepr+/+ (empty circles) and lepr−/− (filled circles) adult female zebrafish. Data shown as means ± SE (n = 6). PHENOTYPE:
|

Fig. 3. Histology of the ovaries of lepr+/+ (A) and lepr−/− (B) adult female zebrafish. Ratios of different developmental stages of follicles (C) in the ovaries of lepr+/+ (empty bars) and lepr−/− (filled bars) adult female zebrafish. Data shown as mean ± SE (n = 6). Stages of follicular development: primary growth (PG), pre-vitellogenic (PV), early vitellogenic (EV), middle vitellogenic (MV), full grown (FG), denatured (D). PHENOTYPE:
|
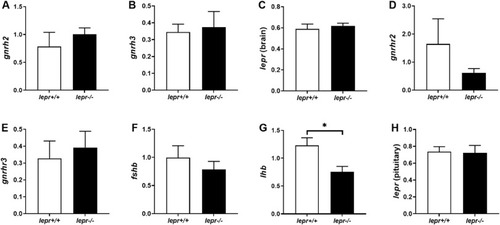
Fig. 4. Relative gene expression of gnrh2 (A), gnrh3 (B) and lepr (C) in the brain and of gnrhr2 (D), gnrhr3 (E), fshb (F), lhb (G) and lepr (H) in the pituitary of lepr+/+ (empty bars) and lepr−/− (filled bars) adult female zebrafish. Data shown as mean ± SE (n = 6). The expression levels of the target genes were normalized to the expression levels of g6pd in the brain samples and to the average of the expression levels of ef1a and rplp0 in the pituitary samples. Significant differences between different groups are indicated by *p < 0.05. |
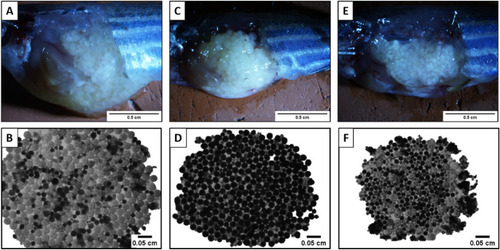
Fig. 5. Ovarian morphology of lepr+/+ and lepr−/− adult female zebrafish. Normal ovulation with mature ovulated oocytes in the ovary of lepr+/+ fish (A–B). Complete anovulation with no mature ovulated oocytes in the ovary of lepr−/− fish (C–D). Partial anovulation with few mature ovulated oocytes in the ovary of lepr−/− fish (E–F). PHENOTYPE:
|
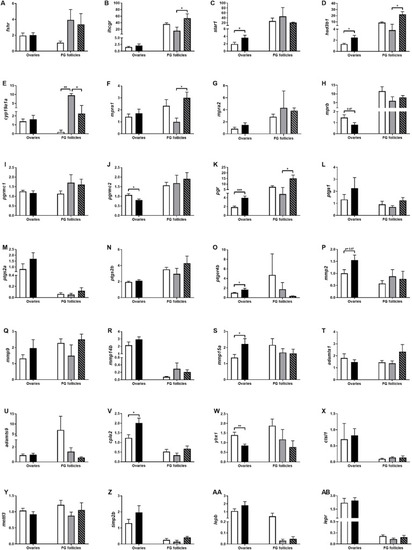
Fig. 6. Relative gene expression of genes involved in ovulation, steroidogenesis and genes of the leptin system in the ovaries and fully grown (FG) follicles of lepr+/+ and lepr−/− adult female zebrafish. Both for ovaries (n = 6) and for FG follicles (n = 3–6) data are shown as mean ± SE. The expression levels of the target genes were normalized to the expression levels of ef1a. Significant differences between different groups are indicated by *p < 0.05, **p < 0.01, ***p < 0.001. For the ovaries: empty bars indicate lepr+/+ and filled bars indicate lepr−/− ovaries. For the FG follicles: empty bars indicate follicles from lepr+/+ females, filled bars follicles from lepr−/− females which were not laying eggs and striped bars follicles from lepr−/− females which were laying few eggs. |
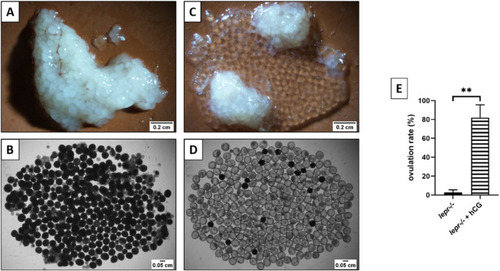
Fig. 7. hCG administration restores ovulation in lepr−/− female zebrafish. Ovarian morphology of lepr−/− adult female zebrafish before (A–B) and after (C–D) intraperitoneal administration of hCG. Comparison of the number of ovulated follicles from lepr−/− females before and after hCG administration (E). Data shown as mean ± SE (n = 3). Significant differences between different groups are indicated by **p < 0.01. PHENOTYPE:
|
Reprinted from Molecular and Cellular Endocrinology, 546, Tsakoumis, E., Ahi, E.P., Schmitz, M., Impaired leptin signaling causes subfertility in female zebrafish, 111595, Copyright (2022) with permission from Elsevier. Full text @ Mol. Cell. Endocrinol.