
- Title
-
Acidic pH reduces agonist efficacy and responses to synaptic-like glycine applications in zebrafish α1 and rat α1β recombinant glycine receptors
- Authors
- Ivica, J., Lape, R., Sivilotti, L.G.
- Source
- Full text @ J. Physiol.

Acidic pH reduces agonist potency and efficacy measured from whole?cell GlyR responses
Upper panels, whole?cell current responses to U?tube agonist applications to HEK 293 cells expressing zebrafish ?1 GlyR in acidic pH 6.4 (A), physiological pH 7.4 (B) and alkaline pH 8.4 (C). Lower panels, averaged concentration?response curves to glycine (open circles), ??alanine (open squares) and taurine (open triangles) (n = 5?10; see Table 1; responses are normalised to those to saturating glycine concentrations, 10 or 30 mM, in each cell; error bars show SD values). Data at pH 7.4 are from Ivica et al. (2021). |
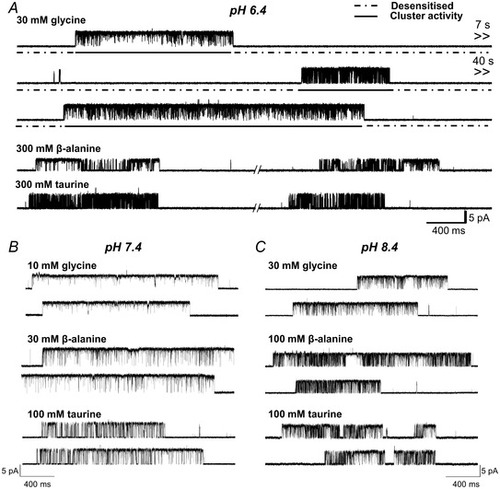
Acidic pH decreases agonist efficacy in zebrafish ?1 GlyR
Representative single?channel traces were recorded in the cell?attached configuration at saturating agonist concentrations at pH 6.4, 7.4 and 8.4 (panels A, B and C, respectively; upward deflections show channel openings, currents are inward and are caused by chloride exit). |
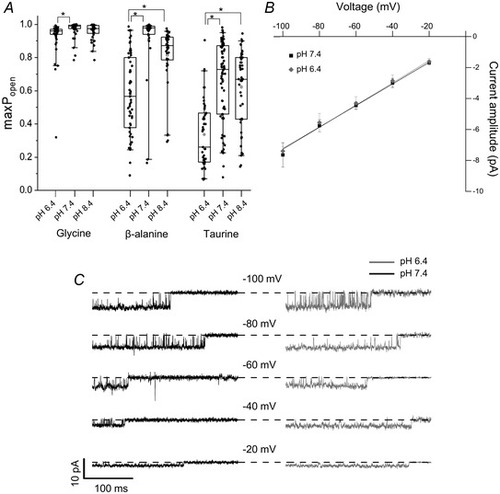
Acidic pH decreases agonist efficacy but does not affect the conductance of zebrafish ?1 GlyR
A, cluster P open values produced by saturating agonist concentrations at pH 6.4, 7.4 and 8.4; data at pH 7.4 are from Ivica et al. (2021). Boxes and whiskers show the 25th and 75th and the 5th and 95th percentiles, respectively. The horizontal line in the box is the median. Asterisked brackets denote significance; see text for P values. B, current?voltage relationship for ?1 GlyR single?channel openings at pH 6.4 (grey diamonds) and at pH 7.4 (black squares) recorded from outside?out patches (n = 4 patches, error bars represent SD; the black and the grey lines are fits to the data pooled from four patches at pH 7.4 and 6.4, respectively). C, traces are outside?out recordings from ?1 GlyR in the presence of 10 mM glycine (symmetrical 131.1 mM chloride). Openings are downward and are inward currents, dashed lines indicate closed level |

Acidification to pH 6.4 reduces the amplitude and changes the time course of outside?out responses of zebrafish ?1 GlyR to fast agonist applications
A, representative inward currents elicited by 2 ms pulses of glycine, ??alanine, taurine and GABA, at pH 7.4 (black) or 6.4 (grey). Traces are averages of at least five current responses and patches were held at ?100 mV. In the right panels the responses are scaled to their peak to allow comparison of current kinetics (see also expanded insets). B, bar chart presenting the peak amplitudes of concentration pulses measured for glycine, alanine, taurine and GABA; error bars show SD, lines connect values from the same patch. C and D, decay and rise time constants, respectively, for currents elicited by the four agonists at pH 7.4 (black) and 6.4 (grey). Horizontal lines are means and lines connect values from the same patch. Asterisked brackets in B, C and D show comparisons that were statistically significant; see Table 3 for P values. |

Acidic pH reversibly reduces the amplitude of glycine responses of zebrafish ?1 GlyR in 30 mM intracellular chloride
A, consecutive current responses recorded from the same outside?out patch, held at ?100 mV, in response to 3 mM 2 ms glycine pulses at pH 7.4 and after pH change to 6.4 (of both the agonist and the control solution; grey traces) and back to 7.4. Responses obtained during the solution exchange in the application tool are marked by a black dashed line above the traces and were not analysed. B, plot of the peak amplitude of the responses shown in the same patch. C, peak amplitudes of glycine responses in patches with recovery. Asterisked brackets denote significance, P = 0.0025 and P = 0.001 when amplitude at pH 6.4 is compared to the preceding or the following pH 7.4 control. |
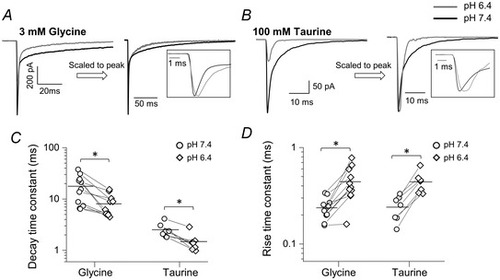
The effects of acidic pH on the time course of fast agonist responses of zebrafish ?1 GlyR (30 mM intracellular chloride)
Representative macroscopic inward currents elicited by 2 ms concentration pulses of glycine (A) and taurine (B) from outside?out patches held at ?100 mV (?110 mV when corrected for junction potential). Traces are averages of at least five current responses. In the right panels the responses are scaled to their own peak to allow comparison of current kinetics; see also insets. C and D, decay and rise time constants, respectively, for glycine and taurine responses at pH 6.4 (diamonds) and 7.4 (circles). Horizontal line are means and lines connect the measurements from the same patch. Asterisked brackets in C and D denote significance, in paired t tests; for P values see text and Table 4. |
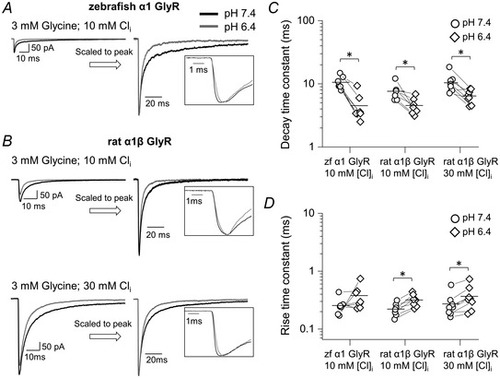
The effects of acidic pH on responses relevant to native synaptic currents on zebrafish ?1 GlyR and rat ?1? GlyR 10 mM intracellular chloride
The panels on the left show macroscopic inward currents elicited by 3 mM, 2 ms concentration pulses of glycine on homomeric zebrafish ?1 GlyR (A) and heteromeric rat ?1? GlyR (B) recorded in outside?out patches held at a nominal potential of ?100 mV (actual value, ?110 and ?113 mV for experiments with 30 and 10 mM intracellular chloride, respectively). Traces are averages of at least five current responses. C and D, decay and rise time constants, respectively, for glycine and taurine responses at pH 6.4 (diamonds) and 7.4 (circles). Horizontal lines are means and lines connect the measurements from the same patch. Asterisked brackets in C and D denote significance, in paired t tests, for P values see text and Table 4. |