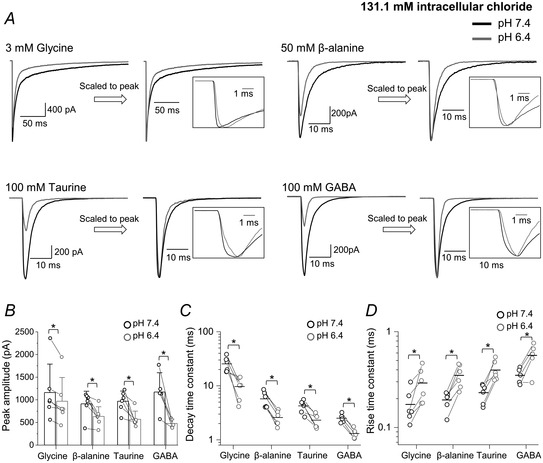
Fig. 4
A, representative inward currents elicited by 2 ms pulses of glycine, β‐alanine, taurine and GABA, at pH 7.4 (black) or 6.4 (grey). Traces are averages of at least five current responses and patches were held at −100 mV. In the right panels the responses are scaled to their peak to allow comparison of current kinetics (see also expanded insets). B, bar chart presenting the peak amplitudes of concentration pulses measured for glycine, alanine, taurine and GABA; error bars show SD, lines connect values from the same patch. C and D, decay and rise time constants, respectively, for currents elicited by the four agonists at pH 7.4 (black) and 6.4 (grey). Horizontal lines are means and lines connect values from the same patch. Asterisked brackets in B, C and D show comparisons that were statistically significant; see Table 3 for P values.

