
|
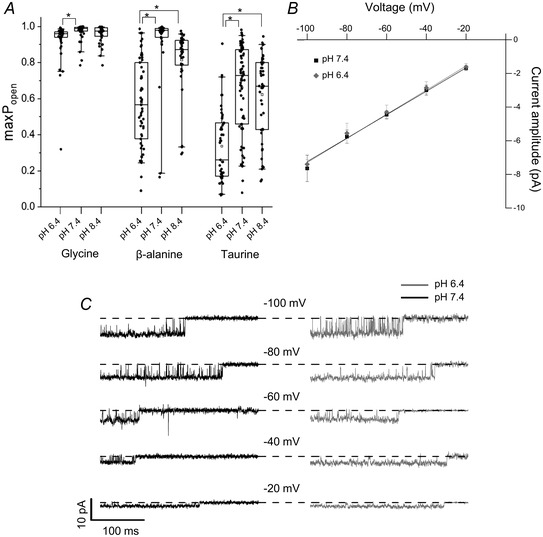
Fig. 3
A, cluster P open values produced by saturating agonist concentrations at pH 6.4, 7.4 and 8.4; data at pH 7.4 are from Ivica et al. (2021). Boxes and whiskers show the 25th and 75th and the 5th and 95th percentiles, respectively. The horizontal line in the box is the median. Asterisked brackets denote significance; see text for P values. B, current‐voltage relationship for α1 GlyR single‐channel openings at pH 6.4 (grey diamonds) and at pH 7.4 (black squares) recorded from outside‐out patches (n = 4 patches, error bars represent SD; the black and the grey lines are fits to the data pooled from four patches at pH 7.4 and 6.4, respectively). C, traces are outside‐out recordings from α1 GlyR in the presence of 10 mM glycine (symmetrical 131.1 mM chloride). Openings are downward and are inward currents, dashed lines indicate closed level