
Image
|
Figure Caption
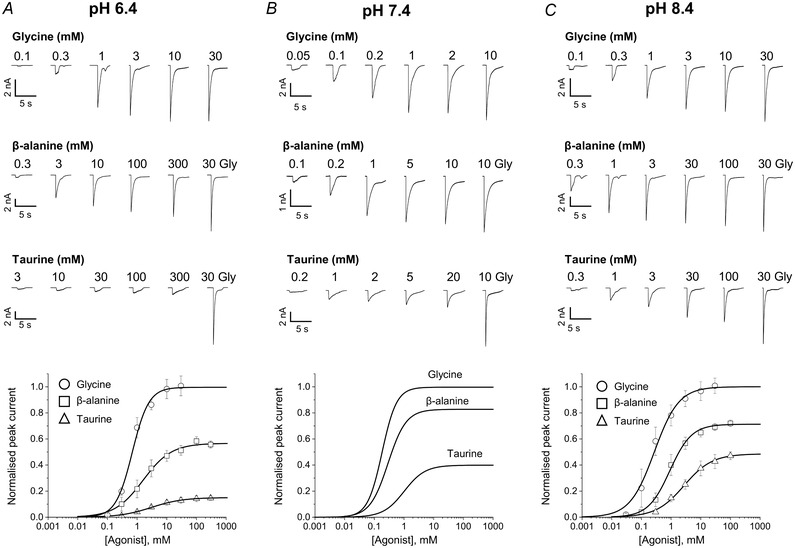
Fig. 1
Acidic pH reduces agonist potency and efficacy measured from whole‐cell GlyR responses
Upper panels, whole‐cell current responses to U‐tube agonist applications to HEK 293 cells expressing zebrafish α1 GlyR in acidic pH 6.4 (A), physiological pH 7.4 (B) and alkaline pH 8.4 (C). Lower panels, averaged concentration‐response curves to glycine (open circles), β‐alanine (open squares) and taurine (open triangles) (n = 5–10; see Table 1; responses are normalised to those to saturating glycine concentrations, 10 or 30 mM, in each cell; error bars show SD values). Data at pH 7.4 are from Ivica et al. (2021).
Acknowledgments
This image is the copyrighted work of the attributed author or publisher, and
ZFIN has permission only to display this image to its users.
Additional permissions should be obtained from the applicable author or publisher of the image.
Full text @ J. Physiol.