FIGURE SUMMARY
Title

Targeting of SET/I2PP2A oncoprotein inhibits Gli1 transcription revealing a new modulator of Hedgehog signaling

Authors
Serifi, I., Besta, S., Karetsou, Z., Giardoglou, P., Beis, D., Niewiadomski, P., Papamarcaki, T.
Source
Full text @ Sci. Rep.

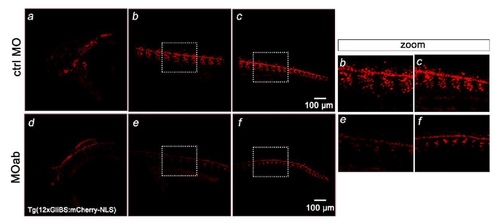
Hh signaling is reduced in Tg12x_Gli transgenic zebrafish embryos injected with seta/b morpholino (MOab).

One- to two-cell stage Tg12x_Gli transgenic zebrafish embryos were injected with 7.5 ng of seta/b translation blocking morpholino (MOab) and examined under a confocal fluorescence microscope (n=62). The squares show enlargement of the trunk areas which display decreased mCherry fluorescence intensity. Note the disrupted morphology of the somites in the marked regions.

EXPRESSION / LABELING:
Gene:
Fish:
Knockdown Reagent:
Anatomical Term:
Stage: Prim-5
PHENOTYPE:
Fish:
Knockdown Reagent:
Observed In:
Stage: Prim-5

Impact of targeting the setb gene on Hedgehog signaling in zebrafish embryos. (A) Zebrafish setb crispants exhibit cyclopia. One- to two-cell stage zebrafish embryos were injected with 4.6 nl of 150 ng/μl of Cas9 mRNA or with 50 ng/μl of setb gRNA and 150 ng/μl of Cas9 mRNA and were examined morphologically at 48 hpf. (Right graph). Phenotypic scoring of the injected embryos (n = 262, n denotes the number of injected embryos). Numbers in X-axis refer to percentage of embryos in each phenotypic group and numbers on the bars refer to the percentage of cyclopic embryos in each phenotypic group. (B) Hh signaling is reduced in Tg12x_Gli transgenic zebrafish embryos injected with setb gRNA/Cas9. One- to two-cell stage Tg12x_Gli transgenic zebrafish embryos were injected with setb gRNA/Cas9 and examined under a confocal fluorescence microscope at 24 hpf. The phenotypic scoring of the injected embryos is shown in the graph (n = 96). The squares show enlargement of the trunk areas that display decreased mCherry fluorescence intensity. Note the disrupted morphology of the somites in the marked regions.

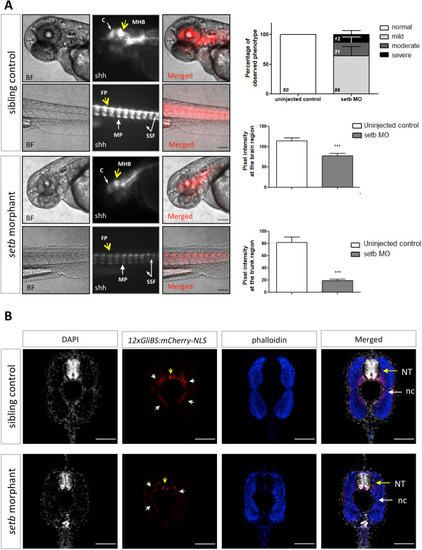
Activation of Hh signaling is reduced in setb morphants. (A) Fluorescent and brightfield images of 48 hpf setb-morpholino injected and control sibling Tg12x_Gli embryos. Embryos are placed anterior to left, dorsal up. Scale bars 100 μm. Quantification of pixel intensity at 48 hpf of the morphologically mildly affected embryos (***p < 0.001). Data are expressed as mean ± SEM (n = 129, after exclusion of the injected embryos developing apoptotic tissue at 24 hpf). Percentage of phenotypic scoring of 48 hpf morphants is presented with mean ± SEM and the numbers of total embryos per group is indicated. At the brain region: cerebellum (c, white arrow), mid-hindbrain boundary (MHB, yellow arrow). At the trunk region: floor plate (FP, yellow arrow), slow muscle pioneer cells (MP, white arrow, high mCherry signal), superficial slow fibers (SSF, white arrows, mid mCherry signal). (B) Confocal images of cross-sections throughout the trunk region of 48 hpf setb morphants and age-matched siblings. Note the reduction of mCherry+ cells at the ventral side of neural tube (yellow arrows) and at the slow fibers surrounding notochord (white arrows) of setb morphants; indication of lower activation levels of the Hh pathway. Sections were stained with phalloidin-633 (blue) and DAPI (grey). NT: neural tube, nc: notochord. Scale bars 50 μm.

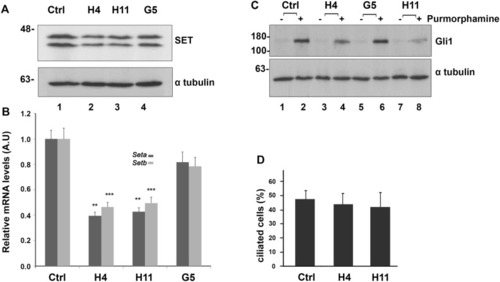
CRISPR/Cas9-mediated SETKD is linked with a decrease in Gli1 expression. (A) SET protein levels in NIH 3T3 control cells and SETKD clones. Western blot analysis of control NIH 3T3, H4, H11 and G5 cell extracts using the anti-I2PP2A and anti-α-tubulin antibodies (loading control). Original uncropped Western Blot images are shown in Supplementary Fig. 2S. (B) Comparison of the relative expression differences for Seta and Setb, the two splicing forms of mouse Set gene, in control NIH 3T3, H4, H11 and G5 cells. The fold changes in qPCR were normalized to Gapdh. Data are expressed as mean ± SEM (n = 3 ) **p < 0.01***p < 0.001. (C) Gli1 expression levels in control NIH 3T3 and SETKD cells. Western blot analysis of extracts obtained from control NIH 3T3 cells and H4, H11 and G5 cells after incubation at 0.5% serum with DMSO (lanes 1, 3, 5, 7) or 2 μM purmorphamine (lanes 2, 4, 6, 8) using the anti-Gli1 and anti-α-tubulin antibodies. Original uncropped Western Blot images are shown in Supplementary Fig. 2S. (D) Ciliation analysis of control NIH 3T3 cells and H4, H11 clones after 24 h of serum starvation. 100–150 cells were analyzed per experiment (n = 3).

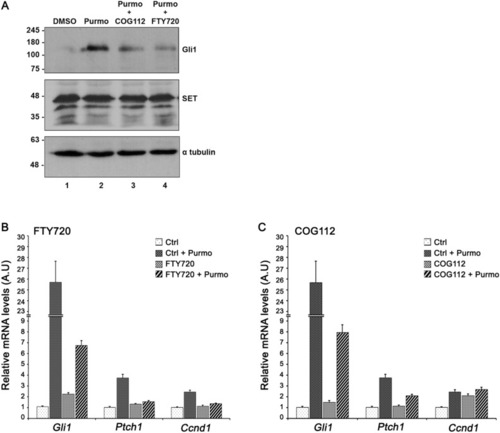
SET inhibitors decrease Gli1 expression. (A) The effect of FTY720 and COG112 on Gli1 protein expression. Western blot analysis of extracts obtained from NIH 3T3 cells after incubation at 0.5% serum with DMSO (lane 1) or 2 μM purmorphamine (lane 2) in the presence of 3 μM COG112 (lane 3) or 5 μM FTY720 (lane 4). Proteins were resolved in 10% SDS-PAGE and the blots were probed with the anti-Gli1, anti-SET and anti-α-tubulin antibodies (loading control). Original uncropped Western Blot images of panel A are shown in Supplementary Fig. 2S. (B, C). The effect of FTY720 and COG112 on the mRNA levels of selected genes related to Hedgehog signaling. Comparison of relative expression differences for Gli1, Ptch1, and Ccnd1 in NIH 3T3 cells cultured at 0.5% serum after incubation with 2 µM purmorphamine in the presence of 5 μΜ FTY720 or 3 μΜ COG112, as determined by qPCR analysis. The mRNA levels of the genes were normalized to Gapdh. The experiments were repeated three times. Data are expressed as mean ± SEM ***p < 0.001.

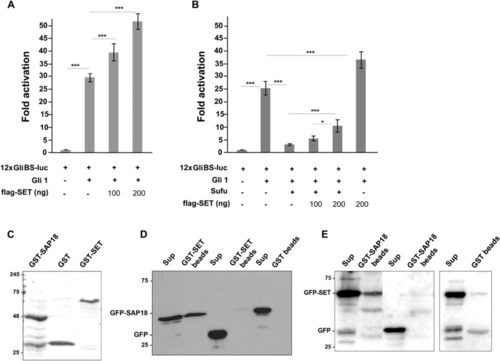
SET overexpression increases Gli1-mediated transcription. (A) The effect of SET on Gli1-mediated transcription. To determine Gli1-mediated transcription upon SET overexpression, 12xGliBS-luc and Gli1 expression plasmids were cotransfected with a human Flag-SET expressing construct in HEK 293 cells. (B) The effect of SET on Sufu inhibition of Gli1-mediated transcription. HEK 293 cells were transfected with 12xGliBS-luc reporter with the indicated amounts of plasmids encoding Gli1 (100 ng), Flag-SET (100 and 200 ng) and Sufu (10 ng). pRL-TK expresses Renilla luciferase and was included in all samples to normalize the transfection efficiency. Experiments were repeated three times and samples were analyzed in triplicates, *p < 0.05, **p < 0.01, ***p < 0.001. (C) Expression of GST-SET and GST-SAP18 recombinant proteins. Bacterially expressed glutathione-S-transferase-tagged SAP18 (GST-SAP18), GST protein and baculovirus expressed GST-SET (approximately 2–3 μg each) were immobilized on glutathione-Sepharose beads and analyzed by 12% SDS-PAGE. An original uncropped image of panel C is shown in Supplementary Fig. 2S. (D) GST-SET pull down experiments. GST-SET or GST was immobilized on glutathione-Sepharose beads and incubated with cell extracts expressing GFP-SAP18 or GFP. (E) GST-SAP18 pull down experiments. GST-SAP18 or GST was immobilized on glutathione-Sepharose beads and incubated with cell extracts expressing GFP-SET or GFP. The beads and the supernatant of the pull down assays were analyzed by western blot using the anti-GFP antibody. Original uncropped Western Blot images of panels D and E are shown in Supplementary Fig. 2S.

Acknowledgments
This image is the copyrighted work of the attributed author or publisher, and ZFIN has permission only to display this image to its users. Additional permissions should be obtained from the applicable author or publisher of the image. Full text @ Sci. Rep.