
Figure 4
- ID
- ZDB-IMAGE-210711-8
- Publication
- Serifi et al., 2021 - Targeting of SET/I2PP2A oncoprotein inhibits Gli1 transcription revealing a new modulator of Hedgehog signaling
- All Figures
- Figures for Serifi et al., 2021
|
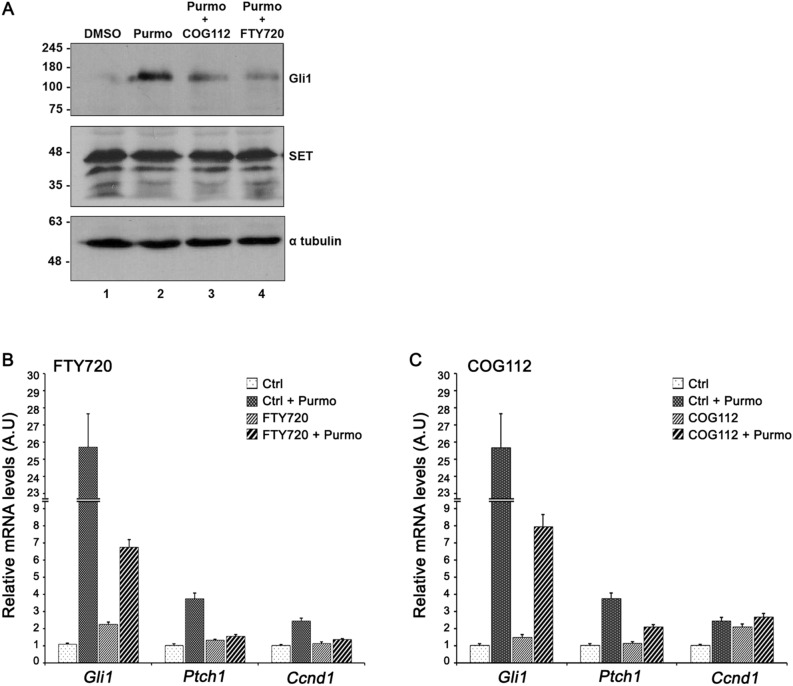
Figure 4 SET inhibitors decrease Gli1 expression. (A) The effect of FTY720 and COG112 on Gli1 protein expression. Western blot analysis of extracts obtained from NIH 3T3 cells after incubation at 0.5% serum with DMSO (lane 1) or 2 μM purmorphamine (lane 2) in the presence of 3 μM COG112 (lane 3) or 5 μM FTY720 (lane 4). Proteins were resolved in 10% SDS-PAGE and the blots were probed with the anti-Gli1, anti-SET and anti-α-tubulin antibodies (loading control). Original uncropped Western Blot images of panel A are shown in Supplementary Fig. 2S. (B, C). The effect of FTY720 and COG112 on the mRNA levels of selected genes related to Hedgehog signaling. Comparison of relative expression differences for Gli1, Ptch1, and Ccnd1 in NIH 3T3 cells cultured at 0.5% serum after incubation with 2 µM purmorphamine in the presence of 5 μΜ FTY720 or 3 μΜ COG112, as determined by qPCR analysis. The mRNA levels of the genes were normalized to Gapdh. The experiments were repeated three times. Data are expressed as mean ± SEM ***p < 0.001.