
- Title
-
Inhibition of the HEG1-KRIT1 interaction increases KLF4 and KLF2 expression in endothelial cells
- Authors
- Lopez-Ramirez, M.A., McCurdy, S., Li, W., Haynes, M.K., Hale, P., Francisco, K., Oukoloff, K., Bautista, M., Choi, C.H.J., Sun, H., Gongol, B., Shyy, J.Y., Ballatore, C., Sklar, L.A., Gingras, A.R.
- Source
- Full text @ FASEB Bioadv
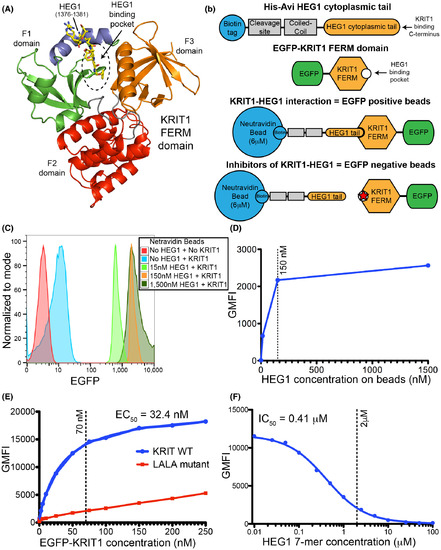
Flow cytometry assay for the HEG1–KRIT1 FERM domain interaction. (A) Ribbon diagram of KRIT1 FERM domain in complex with the HEG1 cytoplasmic tail (PDB ID: 3u7d). The HEG1 peptide is shown in yellow. The KRIT1 FERM domain consists of three subdomains: F1 (green and blue); F2 (red); and F3 (orange). The feature of the F1 domain that is not present in other FERM domain is shown in blue and that region is an important part of the HEG1 binding pocket. (B) Schematic representation of the HEG1 cytoplasmic tail (a.a. 1274–1381) peptide coupled to Neutravidin beads and the EGFP-KRIT1 FERM domain. Binding of EGFP-KRIT1 FERM domain to the HEG1 matrix beads can be detected by flow cytometry. Small-molecule inhibitors HKi preventing the interaction of EGFP-KRIT1 FERM domain with the HEG1 matrix beads reduce the EGFP fluorescence signal. (C) Flow cytometry profile of SPHERO Neutravidin Polystyrene Particles coated with increasing amount of biotinylated HEG1 peptide and 150 nM EGFP-KRIT1 FERM domain. We noticed many beads doublets in the light scatter signal at 1,500 nM concentration of HEG1 peptide. (D) Titration curve for the interaction of EGFP-KRIT1 FERM domain with increasing amounts of HEG1 on the beads as shown in panel C, as measured by geometric mean fluorescence intensity (GMFI). We used the 150 nM HEG1 peptide concentration for future experiments. (E) Titration curve for the interaction of 150 nM HEG1 on the beads with increasing amounts of EGFP-KRIT1 FERM domain (0–250 nM) wild-type (blue line) and KRIT1(L717,721A) mutant (red line). We used the 70 nM EGFP-KRIT1 concentration for future experiments. (F) Competition binding curve of 70 nM EGFP-KRIT1 FERM domain binding to 150 nM HEG1 on the beads with increasing amounts on non-biotinylated HEG1 7-mer peptide. We used the 2 μM HEG1 7-mer concentration for future experiments. |
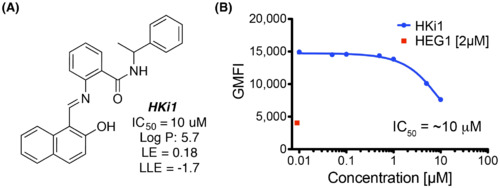
HKi1 is an inhibitor of the HEG1–KRIT1 interaction. (A) Chemical structure of HKi1. LE = (1.37/HA) x pIC50 where HA is the number of non H atoms present in the ligand; LLE = pIC50-LogP. (B) Competition binding curve of 70 nM EGFP-KRIT1 FERM domain binding to 150 nM HEG1 on the beads with increasing amounts of HKi1. HKi1 had poor solubility in our buffer and concentrations >30 μM could not be reached. |
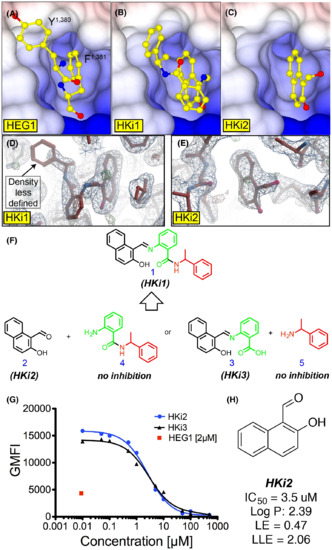
Structure guided HEG1–KRIT1 interaction inhibitors. (A-C) Surface charge representation of KRIT1 FERM domain crystal structures in complex with: (A) the HEG1 cytoplasmic tail highlighting the C-terminal Tyr-Phe sitting in the binding pocket (PDB ID: 3u7d); (B) HKi1; and (C) HKi2. Both small-molecule inhibitors HKi1 and HKi2 are sitting in the HEG1 binding pocket of KRIT1. (D-E) Electron density map of the KRIT1 FERM domain bound to: (D) HKi1; and (E) HKi2. Refined 2F0-FC map (blue) and F0-FC at 1σ and 3 σ respectively (red and green). The small naphthalene of HKi1 and HKi2 show good electron density in the HEG1 binding pocket, whilst the electron density for the benzylamine moiety of HKi1 is less defined. (F) Chemical structure of HKi1 constituents. (G) Competition binding curve of 70 nM EGFP-KRIT1 FERM domain binding to 150 nM HEG1 on the beads with increasing amounts on HKi2 and HKi3. (H) Chemical structure of HKi2. LE and LLE are described in Figure 2A. The solubility of HKi2 in aqueous solution is largely improved. |
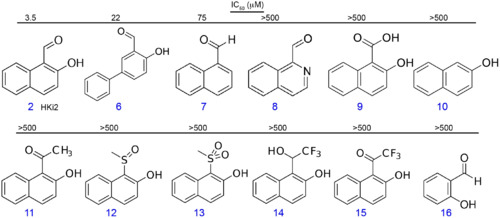
The aldehyde in position C1 and hydroxyl group in position C2 are important for HKi2 activity. The IC50 was measured using a flow cytometry-screening assay. >500 = no inhibition detected up to 500 μM concentration thus IC50 >500 μM. |
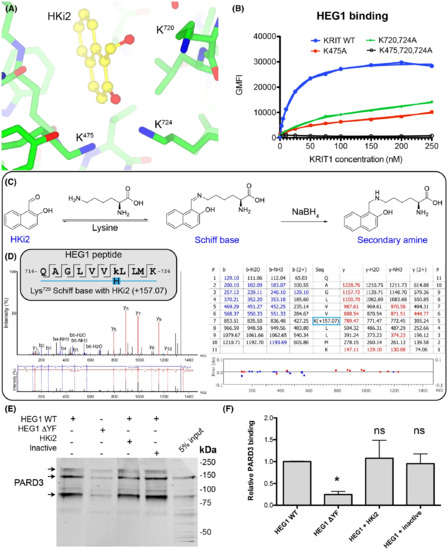
KRIT1 Lys720 forms a covalent reversible bond with the aldehyde of HKi2 and HKi2 does not block PARD3 binding to HEG1. (A) KRIT1 bound to HKi2 highlighting the position of three lysines residues near the HKi2 aldehyde. HKi2 is shown in yellow and KRIT1 residues in green. (B) All tested EGFP-KRIT1 FERM domain mutants tested had reduced HEG1 binding. (C) Expected lysine modification upon treatment with sodium borohydryde to “trap” the Schiff base. (D) LC–MS/MS results. The searches in Peaks used a mass of 157.0653 (in monoisotopic mass) to lysine residues as variable modification. The tryptic peptide containing Lys720 showed such a mass for a lysine residue confirming that it forms a Schiff base with HKi2. (E) HUVEC lysates were incubated with either HEG1 WT or HEG1 ΔYF matrix and western blotted for PARD3. The mixture contained either DMSO, HKi2 or an inactive compound, 2-hydroxy-1-naphthoic acid (compound 9). The binding of PARD3 to HEG1 ΔYF is largely reduced in comparison to HEG1 WT, but neither HKi2 nor an inactive compound, 2-hydroxy-1-naphthoic acid, affected the binding. (F) Relative PARD3 binding from three independent experiments. Mean with SD are shown. ANOVA with a Tukey post hoc test: *, p < 0.05. |

HKi2 treatment leads to KLF2 and KLF4 upregulation in endothelial cells. (A-F) hCMEC/D3 cells treated with HKi2 (50 μM) or vehicle control and analyzed by qPCR for mRNA level. (A, B) Dose response of KLF4 and KLF2 mRNA expression at indicated doses for 12 h. HKi2 induces KLF4 and KLF2 mRNA expression at indicated concentrations. (C, D) Timecourse, HKi2 induces a rapid and sustained upregulation of KLF4 and KLF2 mRNA expression. (E,F) HKi2 treatment for 4 h upregulated (E) KLF4, and (F) KLF2, and an inactive compound, 2-hydroxy-1-naphthoic acid (50 μM) (compound 9), did not. (A-F) Bar graphs represent mRNA levels relative to vehicle control ± SEM with: (A-D) n = 3, t test and (E,F) n = 4, one-way ANOVA. *, p < 0.05; **, p < 0.01; ***, p < 0.001. (G) Representative images of hCMEC/D3 cells treated for 12 h with HKi2 (50 μM) or inactive compound (50 μM), 2-hydroxy-1-naphthoic acid, and analyzed by Immunofluorescence for KLF4 protein levels. KLF4 expression is increased after treatment with HKi2. (H) Cell viability as assessed by flow cytometry using Propidium Iodide staining, no significant difference between vehicle, HKi2 and inactive compound, 2-hydroxy-1-naphthoic acid. Percentage of viable cells ± SEM. n=3, one-way ANOVA. |

HKi2 treatment leads to KLF4 and KLF2 upregulation, and their important transcriptional targets. (A-E) HUVEC treated with HKi2 (75 μM) or vehicle control for 24 h. (A,B) Dose response of KLF4 and KLF2 mRNA expression as determined by qPCR at indicated doses. HKi2 induces KLF4 and KLF2 mRNA expression at indicated concentrations. Bar graphs represent mRNA levels relative to vehicle control ± SEM (n = 3, t test). *, p < 0.05; **, p < 0.01; ***, p < 0.001. (C-E) Expression levels of differentially expressed genes upon HKi2 treatment. (C) Scatter plot of RNA-Seq data; reads per kilobase of transcript per million mapped reads (RPKM) of individual transcripts are represented on a log2 scale. A few of the most highly suppressed and up-regulated genes are labeled. (D,E) qPCR of representative: (D) upregulated; and (E) downregulated genes (n = 4, one-way ANOVA). ***, p < 0.001. |

HKi2 induces expression of klf2a in arterial and venous endothelium in zebrafish. (A,B) Tg(klf2a:H2b-EGFP;kdrl:mCherry) zebrafish embryos klf2a expression reporter (EGFP) and endothelial cells labeling (mCherry) after treatment with: (A) 4 μM HKi2; or (B) 4 μM inactive compound, 2-hydroxy-1-naphthoic acid (compound 9). The compounds were added at 26 hpf, and images were taken at 30 hpf. The trunk vessels were scanned using Airyscan. Star and square indicate dorsal aorta and posterior cardinal vein, respectively. Lateral view with anterior to the bottom and dorsal to the top. (C) Quantification of the EGFP fluorescence intensity using imageJ. A total of seven nuclei were analyzed per embryo, two HKi2 treated and two inactive compound embryos per experiment, and results from two independent experiments were analyzed. (n = 2, one-way ANOVA). **, p < 0.01; ***, p < 0.001. |
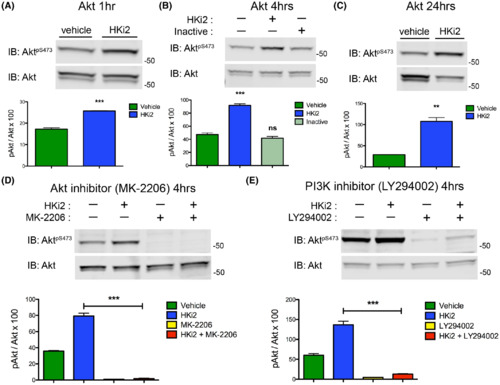
HKi2 treatment increases Akt phosphorylation at S473 that is dependent on PI3K activity. (A-E) hCMEC/D3 cells treated with HKi2 (50 μM) or vehicle control. Cells lysates were analyzed by western blot for Akt and p-Atk S473 protein levels. (A) HKi2 treatment for 1 h activated Akt signaling. (B) HKi2 treatment for 4 h activated Akt signaling and an inactive compound (50 μM), 2-hydroxy-1-naphthoic acid, did not (compound 9). (C) HKi2 treatment for 24 h activated Akt signaling, but the total levels of total Akt were going down. (D,E) Blocking the kinase activity of (E) Akt with MK-2206 (20 μM) and (F) PI3K with LY294002 (10 μM) blunted the activation of Akt by HKi2. (A-H) Bar graphs represent average ± SEM (n = 4), with (A,C) t test, and (B,D,E) one-way ANOVA. *, p < 0.05; **, p < 0.01; ***, p < 0.001. |
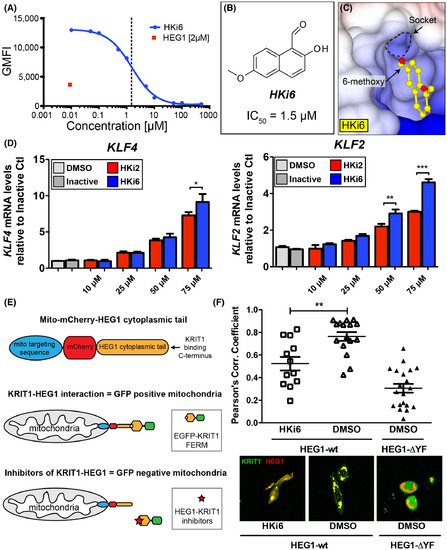
The HEG1–KRIT1 interaction can be disrupted in cells by a small-molecule inhibitor HKi6. (A) Competition binding curve of 70 nM EGFP-KRIT1 FERM domain binding to 150 nM HEG1 on the beads with increasing amounts on HKi6. (B) Chemical structure of HKi6. (C) Surface charge representation of KRIT1 FERM domain crystal structures in complex with HKi6 sitting in the HEG1 binding pocket of KRIT1 (PDB ID: 6uzk). (D) Dose response of KLF4 and KLF2 mRNA expression at indicated doses for 4 h. HKi6 has increased potency in upregulating KLF4 and KLF2 mRNA expression in HUVECs, compared to the same dose of HKi2. Inactive compound was at (75 μM) treatment. Bar graphs represent average ± SEM (n = 4), one-way ANOVA. *, p < 0.05; **, p < 0.01; ***, p < 0.001. (E) Schematic representation of a novel assay to assess the HEG1–KRIT1 interaction in living cells. Mito-mCherry-HEG1 is targeted to mitochondria and the recruitment of EGFP-KRIT1 FERM domain to HEG1 can be measured by colocalization. (F) Small-molecule inhibitor HKi6 prevents the interaction of KRIT1 with HEG1 in living cells. EGFP-KRIT1 is colocalized with mCherry-HEG1 wild-type at the mitochondria, but not with the HEG1-ΔYF missing the last 2 C-terminal amino acids that are important for KRIT1 binding (negative control). Bar graphs represent the Pearson colocalization coefficient relative to DMSO vehicle control. Average ± SEM (one-way ANOVA). **, p < 0.01. |