
|
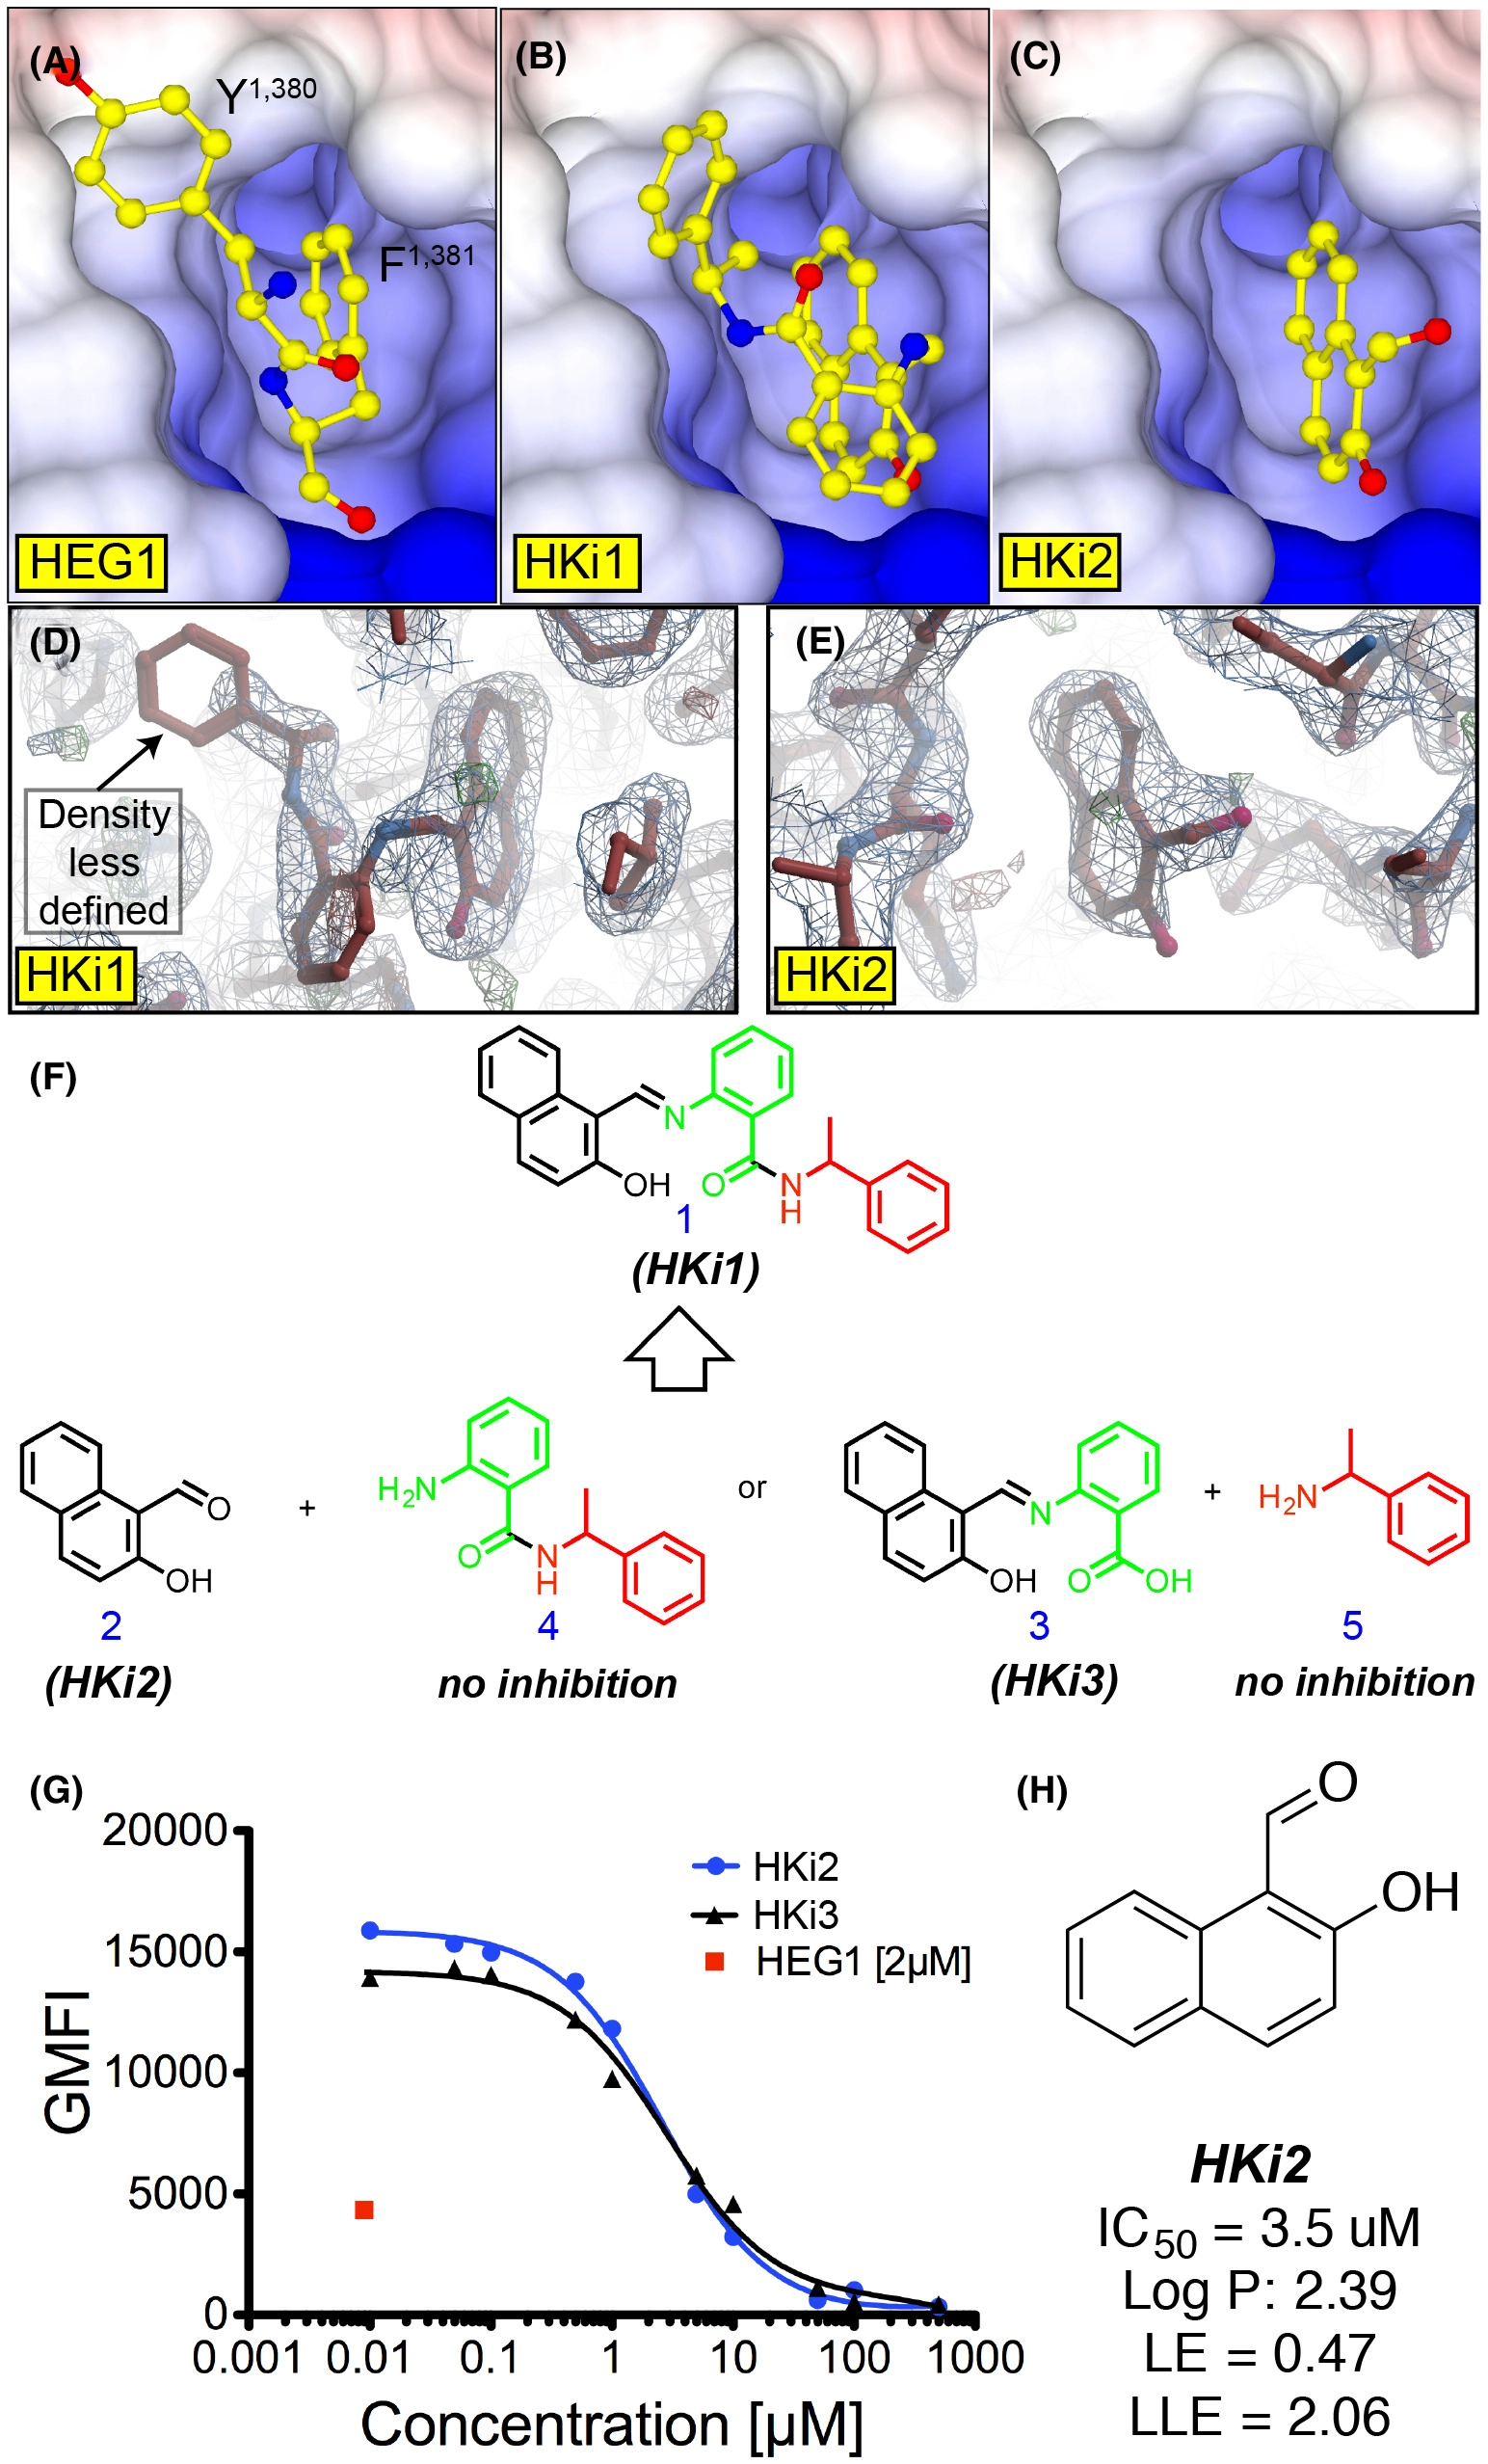
Fig. 3 Structure guided HEG1–KRIT1 interaction inhibitors. (A-C) Surface charge representation of KRIT1 FERM domain crystal structures in complex with: (A) the HEG1 cytoplasmic tail highlighting the C-terminal Tyr-Phe sitting in the binding pocket (PDB ID: 3u7d); (B) HKi1; and (C) HKi2. Both small-molecule inhibitors HKi1 and HKi2 are sitting in the HEG1 binding pocket of KRIT1. (D-E) Electron density map of the KRIT1 FERM domain bound to: (D) HKi1; and (E) HKi2. Refined 2F0-FC map (blue) and F0-FC at 1σ and 3 σ respectively (red and green). The small naphthalene of HKi1 and HKi2 show good electron density in the HEG1 binding pocket, whilst the electron density for the benzylamine moiety of HKi1 is less defined. (F) Chemical structure of HKi1 constituents. (G) Competition binding curve of 70 nM EGFP-KRIT1 FERM domain binding to 150 nM HEG1 on the beads with increasing amounts on HKi2 and HKi3. (H) Chemical structure of HKi2. LE and LLE are described in Figure 2A. The solubility of HKi2 in aqueous solution is largely improved.