
|
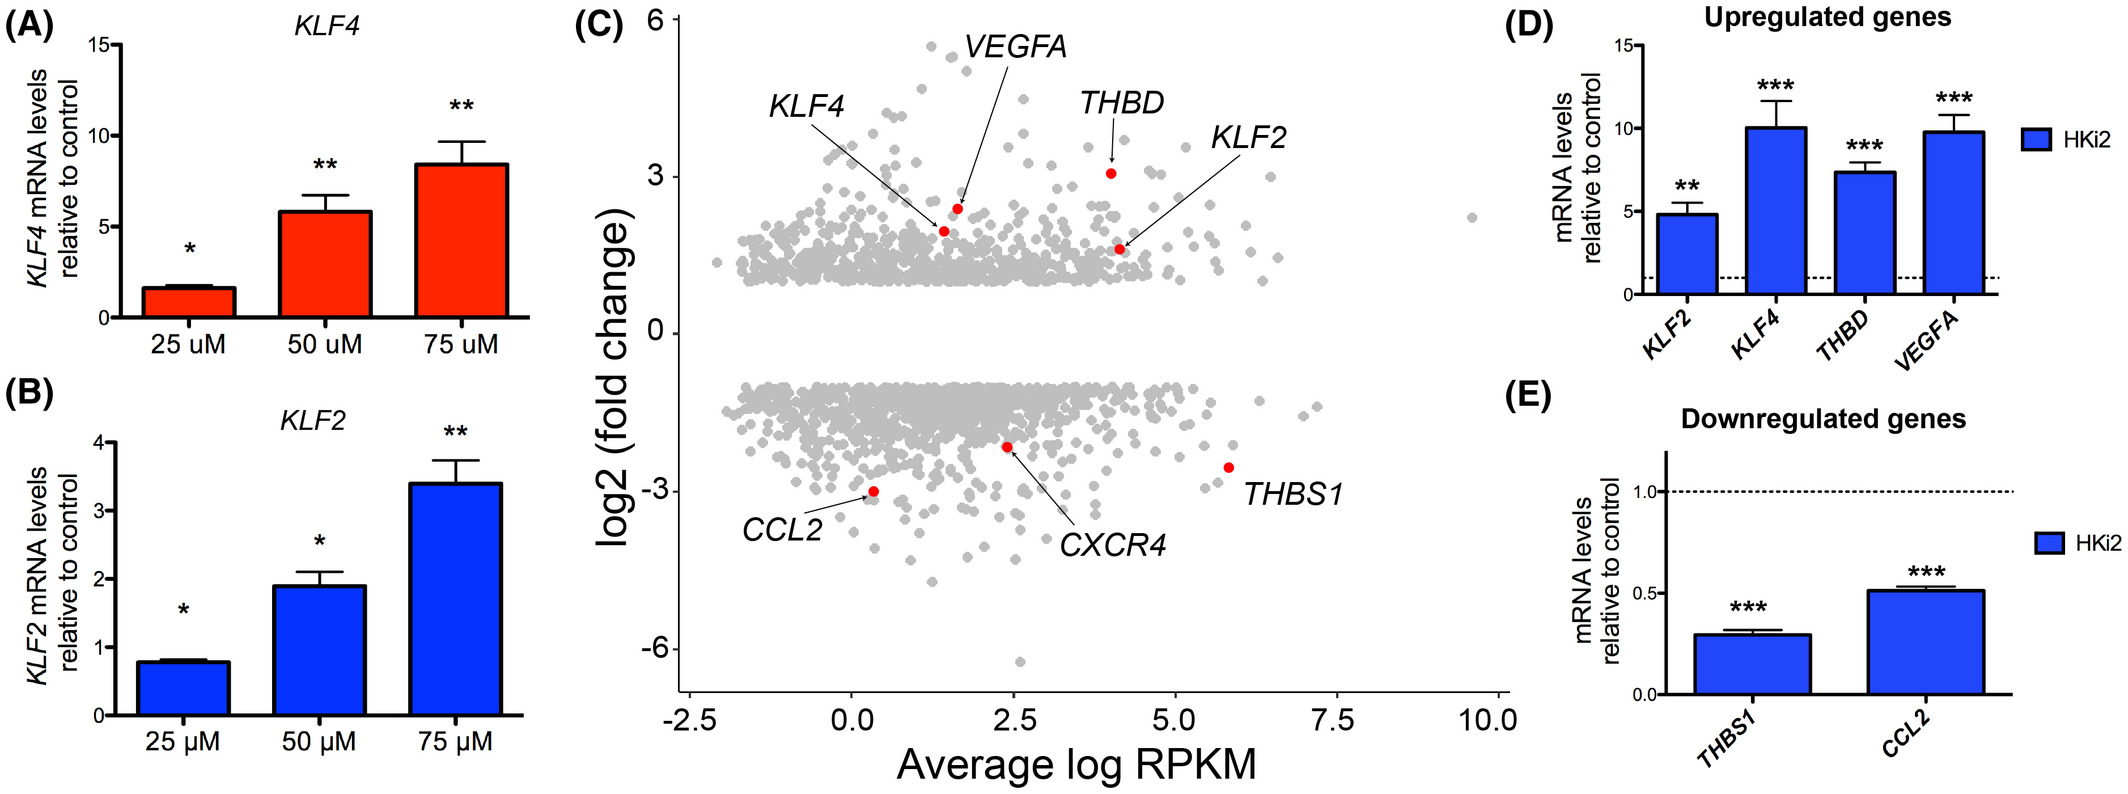
Fig. 7 HKi2 treatment leads to KLF4 and KLF2 upregulation, and their important transcriptional targets. (A-E) HUVEC treated with HKi2 (75 μM) or vehicle control for 24 h. (A,B) Dose response of KLF4 and KLF2 mRNA expression as determined by qPCR at indicated doses. HKi2 induces KLF4 and KLF2 mRNA expression at indicated concentrations. Bar graphs represent mRNA levels relative to vehicle control ± SEM (n = 3, t test). *, p < 0.05; **, p < 0.01; ***, p < 0.001. (C-E) Expression levels of differentially expressed genes upon HKi2 treatment. (C) Scatter plot of RNA-Seq data; reads per kilobase of transcript per million mapped reads (RPKM) of individual transcripts are represented on a log2 scale. A few of the most highly suppressed and up-regulated genes are labeled. (D,E) qPCR of representative: (D) upregulated; and (E) downregulated genes (n = 4, one-way ANOVA). ***, p < 0.001.