
Fig. 10
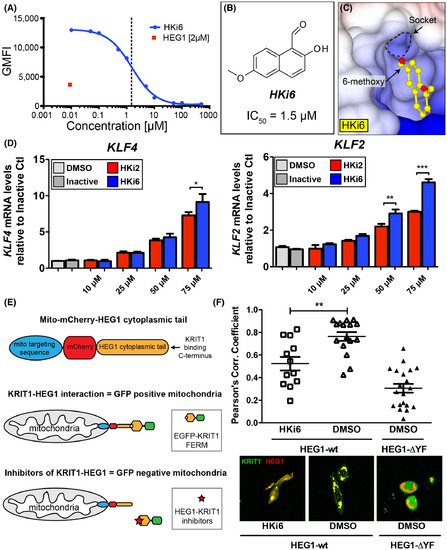
The HEG1–KRIT1 interaction can be disrupted in cells by a small-molecule inhibitor HKi6. (A) Competition binding curve of 70 nM EGFP-KRIT1 FERM domain binding to 150 nM HEG1 on the beads with increasing amounts on HKi6. (B) Chemical structure of HKi6. (C) Surface charge representation of KRIT1 FERM domain crystal structures in complex with HKi6 sitting in the HEG1 binding pocket of KRIT1 (PDB ID: 6uzk). (D) Dose response of KLF4 and KLF2 mRNA expression at indicated doses for 4 h. HKi6 has increased potency in upregulating KLF4 and KLF2 mRNA expression in HUVECs, compared to the same dose of HKi2. Inactive compound was at (75 μM) treatment. Bar graphs represent average ± SEM (n = 4), one-way ANOVA. *, p < 0.05; **, p < 0.01; ***, p < 0.001. (E) Schematic representation of a novel assay to assess the HEG1–KRIT1 interaction in living cells. Mito-mCherry-HEG1 is targeted to mitochondria and the recruitment of EGFP-KRIT1 FERM domain to HEG1 can be measured by colocalization. (F) Small-molecule inhibitor HKi6 prevents the interaction of KRIT1 with HEG1 in living cells. EGFP-KRIT1 is colocalized with mCherry-HEG1 wild-type at the mitochondria, but not with the HEG1-ΔYF missing the last 2 C-terminal amino acids that are important for KRIT1 binding (negative control). Bar graphs represent the Pearson colocalization coefficient relative to DMSO vehicle control. Average ± SEM (one-way ANOVA). **, p < 0.01. |