FIGURE SUMMARY
Title

Selective Requirements for Vascular Endothelial Cells and Circulating Factors in the Regulation of Retinal Neurogenesis

Authors
Dhakal, S., Rotem-Bamberger, S., Sejd, J.R., Sebbagh, M., Ronin, N., Frey, R.A., Beitsch, M., Batty, M., Taler, K., Blackerby, J.F., Inbal, A., Stenkamp, D.L.
Source
Full text @ Front Cell Dev Biol

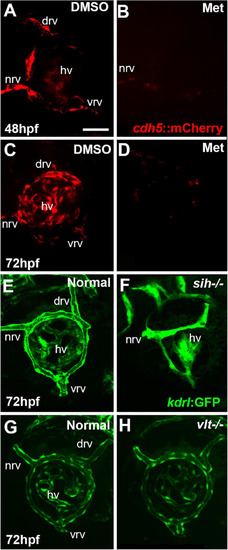
Ocular vasculature of cardiovascular disruption model systems. (A,D). Hyaloid and superficial vessels in zebrafish embryos doubly transgenic for cdh5:gal4 and UAS:nfsB-mCherry, treated with DMSO (controls; A,C), or metronidazole (Met; B,D), viewed at 48 h post-fertilization (hpf; A,B) and 72 hpf (C,D). The dorsal, nasal, and ventral radial vessels (drv, nrv, vrv, respectively) and hyaloid vasculature (hv) are visible in controls but not in Met-treated. (E,F) Hyaloid and superficial vessels of kdrl:eGFP transgenic zebrafish embryos, either normal (E) or sih–/– with no circulation and collapsed vessels (F). (G,H) Hyaloid and radial vessels of kdrl:eGFP transgenic zebrafish embryos, either normal (G) or vlt–/– with no erythrocytes but otherwise normal vasculature (H). Scale bar in A (applies to all) = 50 μm. 7-10 embryos were examined for each condition. All embryos were PTU-treated to prevent pigmentation from interfering with imaging.

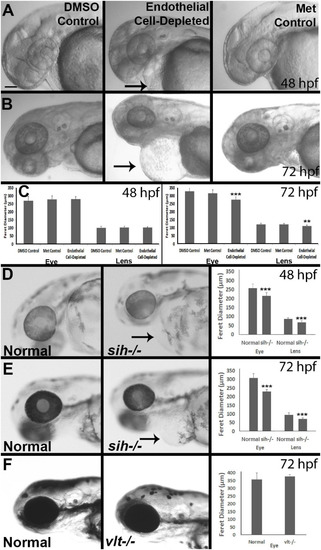
Eye and lens sizes in cardiovascular disruption model systems. (A,B) Live, doubly-transgenic (cdh5:gal4; UAS:nfsB-mCherry), DMSO-treated (DMSO Control), Met-treated (Endothelial Cell-Depleted), and Met-treated clutchmates (Met controls) viewed at 48 hpf (A) and 72 hpf (B). Arrows in middle panel of each indicate swollen epicardial sac. (C). Graphs show average (±s.d.) Feret diameter of eyes and lenses; statistical analysis by ANOVA and Tukey post hoc (48 hpf; n = 15 per condition) and Kruskal-Wallis and Conover’s post hoc (72 hpf; n = 15 DMSO, 14 Met control, and 12 Endothelial cell-depleted). (D,E) Live, normal clutchmates and sih–/– embryos viewed at 48 hpf (D) and 72 hpf (E). Arrows in second panel of each indicate swollen epicardial sac. Graphs in (D,E) show average (±s.d.) Feret diameter of eyes and lenses; statistical analyses by Student’s t-tests (48 hpf; n = 22 normal, 7 sih–/–) and Mann-Whitney test (72 hpf; n = 17 normal, 11 sih–/–). (F) Live, normal clutchmates and vlt–/– embryos viewed at 72 hpf. Graph in (F) shows average (±s.d.) Feret diameter of eyes; statistical analysis by Mann-Whitney test (p = 0.068; n = 12 normal, 13 vlt–/–). Scale bar (in (A), applies to all images) = 100 μm. Statistical notation: **p < 0.01; ***p < 0.001. Embryos in (A–E) were PTU-treated to prevent pigmentation from interfering with visualizing the lens.

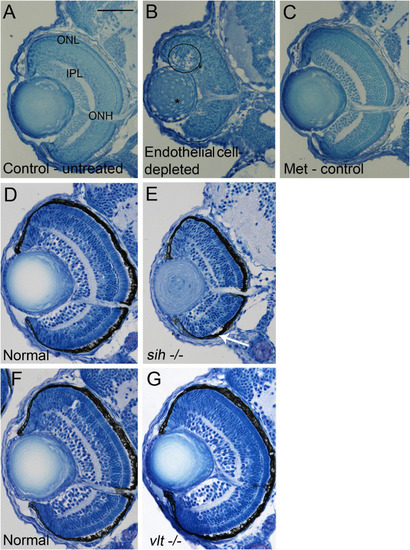
Retinal histology in cardiovascular disruption model systems. (A,C) Plastic, methylene blue/Azure II-stained sections of doubly-transgenic (cdh5:gal4; UAS:nfsB-mCherry), DMSO-treated (DMSO Control, n = 6; (A); Met-treated (Endothelial Cell-Depleted, n = 8; (B); and Met-treated clutchmates (Met Control, n = 2; (C) at 72 hpf. Control retinas show defined nuclear and plexiform layers and photoreceptor apical processes, while endothelial cell-depleted retinas are disorganized, with poorly defined layers, pale, acellular areas containing pyknotic, darkly-stained nuclei (example appears within black circular profile in (B). Interior of lens contains clusters of nuclei (*). (D,E) Plastic sections of normal clutchmates (n = 5; (D) and sih–/– embryos (n = 13; E) at 72 hpf. The inner plexiform layer appears reduced in thickness in sih–/– compared to normal, and there is evidence of photoreceptor apical processes only within a ventral patch (white arrow in (E). (F,G) Plastic sections of normal clutchmates (n = 5; (F) and vlt–/– embryos (n = 9; (G) Histology of vlt–/– retina appears similar to normal siblings at 72 hpf. ONL, outer nuclear layer; IPL, inner plexiform layer; ONH, optic nerve head. Scale bar (in (A), applies to all) = 50 μm. Embryos in (A–C) were PTU-treated; those in D-G were not.

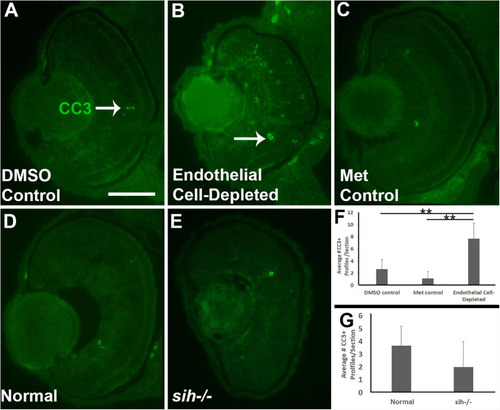
Retinal cell death in cardiovascular disruption model systems. (A,C) Cryosections of doubly-transgenic (cdh5:gal4; UAS:nfsB-mCherry), DMSO-treated (DMSO Control; (A); Met-treated (Endothelial Cell-Depleted; (B); and Met-treated clutchmates (Met Control; (C) at 72 hpf, stained with anti-activated caspase 3 (α-CC3). Control retinas show very few CC3+ profiles (arrow in A), while endothelial cell-depleted retinas display more widespread CC3+ stained-material (arrow in B), indicating cell death. (D,E) Cryosections of normal clutchmates (D) and sih–/– embryos (E), stained with α-CC3. Cell death appears not to be widespread in retinas of sih–/–. Scale bar (in A, applies to A–E) = 50 μm. (F,G) Quantification of CC3+ profiles in retinas of endothelial cell-depleted vs. control embryos (F; **p < 0.01, ANOVA with Tukey post hoc; n = 6 per condition) and sih–/– vs. WT embryos (G; p = 0.16, Student’s t-test; n = 6 per condition).

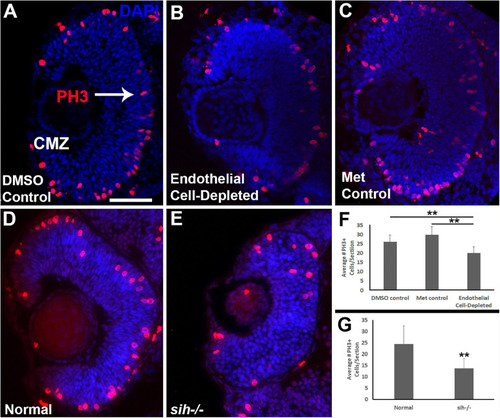
Retinal cell proliferation in cardiovascular disruption model systems. (A,C). Cryosections of doubly-transgenic (cdh5:gal4; UAS:nfsB-mCherry), DMSO-treated (DMSO Control; (A); Met-treated (Endothelial Cell-Depleted; (B); and Met-treated clutchmates (Met Control; (C) at 48 hpf, stained with anti-phosphohistone H3 (PH3; red fluorescence) and counterstained with DAPI (blue). Control retinas show numerous PH3+ profiles, particularly within apical retina (arrow in A) and the ciliary marginal zone (CMZ). Endothelial cell-depleted retinas also display apically-positioned PH3+ cells that appear to be reduced in number (B). (D,E) Cryosections of normal clutchmates (D) and sih–/– embryos (E), stained with α-PH3 and DAPI. Normal retinas show numerous PH3+ profiles while sih–/– retinas display fewer PH3+ cells. Scale bar (in A, applies to A–E) = 50 μm. (F,G) Quantification of PH3+ profiles in retinas of endothelial cell-depleted vs. control embryos (F; **p < 0.01 ANOVA with Tukey post hoc; n = 9 DMSO, 11 Met control, and 14 Endothelial cell-depleted) and sih–/– vs. normal siblings (G; **p < 0.01, Student’s t-test; n = 10 normal, 11 sih–/–).

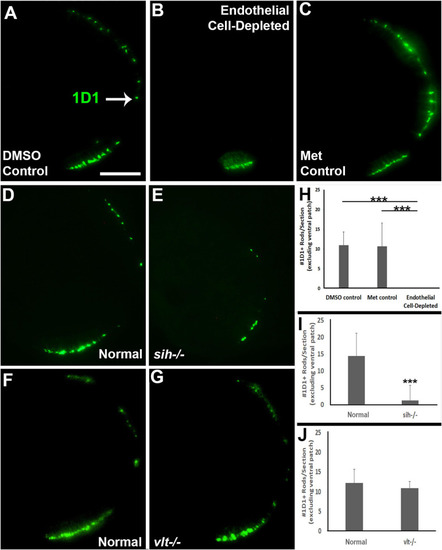
Rod photoreceptors in cardiovascular disruption model systems. (A,C) Cryosections of doubly-transgenic (cdh5:gal4; UAS:nfsB-mCherry), DMSO-treated (DMSO Control; (A); Met-treated (Endothelial Cell-Depleted; (B); and Met-treated clutchmates (Met Control; C) at 72 hpf, stained with 1D1, which labels Rhodopsin. Control retinas show numerous rods (A, arrow), while endothelial cell-depleted retinas display only a patch of rods in ventral retina (B). (D,E) Cryosections of normal clutchmates (D) and sih–/– embryos (E) at 72 hpf, stained with 1D1. Normal retinas show numerous 1D1+ profiles while sih–/– retinas show a reduced number of rods. (F,G) Cryosections of normal clutchmates (F) and vlt–/– embryos (G) at 72 hpf, stained with 1D1, show similar patterns of staining. Scale bar (in A, applies to A–G) = 50 μm. (H,J) Quantification of 1D1+ rods outside the ventral patch, in retinas of endothelial cell-depleted vs. control embryos (H; ***p < 0.001, Kruskal-Wallis with Conover post hoc; n = 6 per condition), sih–/– vs. normal siblings (I; ***p < 0.001, Mann-Whitney test; n = 12 normal, 19 sih–/–), and vlt–/– vs. normal siblings (J; p = 0.55 Student’s t-test; n = 9 normal, 8 vlt–/–).

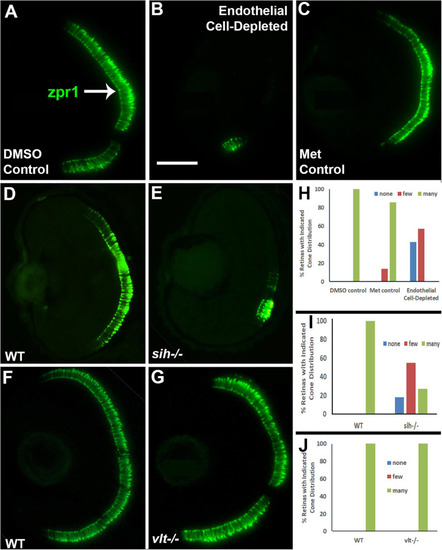
Cone photoreceptors in cardiovascular disruption model systems. (A,C). Cryosections of doubly-transgenic (cdh5:gal4; UAS:nfsB-mCherry), DMSO-treated (DMSO Control; (A); Met-treated (Endothelial Cell-Depleted; (B); and Met-treated clutchmates (Met Control; (C) at 72 hpf, stained with zpr1, which labels red- and green-sensitive (LWS and RH2) double cones. Control retinas show numerous cones (A, arrow), while endothelial cell-depleted retinas display only a patch of cones in ventral retina (B). (D,E) Cryosections of normal clutchmates (D) and sih–/– embryos (E) at 72 hpf, stained with zpr1. Normal retinas show numerous zpr+ profiles while sih–/– retinas show a reduced number of cones. (F,G) Cryosections of normal clutchmates (F) and vlt–/– embryos (G) at 72 hpf, stained with zpr1, show similar patterns of staining. Scale bar (in B, applies to A–G) = 50 μm. (H,J) Assessment of distribution of zpr1+ cones, in retinas of endothelial cell-depleted vs. control embryos (H; p < 0.001, Fisher exact test; n = 7 for each condition), sih–/– vs. normal siblings (I; p < 0.001, Fisher exact test; n = 8 normal, 11 sih–/–), and vlt–/– vs. normal siblings (J; p = 1.0, Fisher exact test; n = 9 normal, 11 vlt–/–).

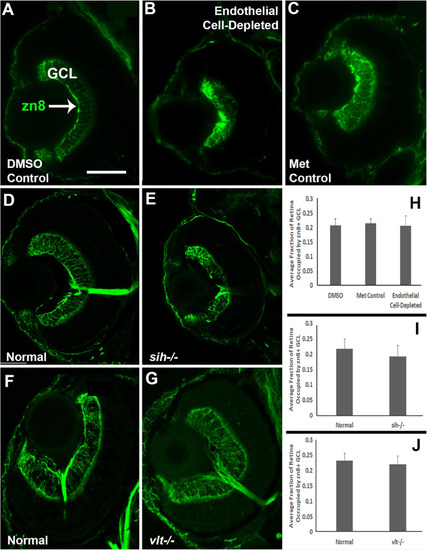
Retinal ganglion cells in cardiovascular disruption model systems. (A,C) Cryosections of doubly-transgenic (cdh5:gal4; UAS:nfsB-mCherry), DMSO-treated (DMSO Control; (A); Met-treated (Endothelial Cell-Depleted; (B); and Met-treated clutchmates (Met Control; (C) at 72 hpf, stained with zn8, which labels DM-Grasp/Neurolin/Alcama, present on neurons growing long axons, and more weakly expressed in neuroepithelial cells. Control retinas show a well-defined layer of retinal ganglion cells within the ganglion cell layer (GCL) (A, arrow), while endothelial cell-depleted retinas display a reduced and disorganized GCL (B). (D,E) Cryosections of normal clutchmates (D) and sih-/- embryos (E) at 72 hpf, stained with zn8. Normal retinas show a clearly stained zn8+ GCL (D) and sih–/– retinas also show clear staining, with the GCL apparently reduced in thickness and slightly disorganized (E). (F,G) Cryosections of normal clutchmates (F) and vlt–/– embryos (G) at 72 hpf, stained with zn8; the GCL of vlt–/– retina appears normal. (H,J) Quantification of fraction of retina occupied by the GCL (GCL/retina ratio), in retinas of endothelial cell-depleted vs. control embryos (H; p < 0.814, Kruskal-Wallis test, post hoc analysis not justified; n = 7 DMSO controls, 8 Met controls, 10 endothelial cell-depleted), sih–/– vs. normal siblings (I; p = 0.147, Mann-Whitney test; n = 12 normal, 11 sih–/–), and vlt–/– vs. normal siblings (J; p = 0.459, Mann-Whitney test; n = 13 normal, 21 vlt–/–). Scale bar (in A, applies to all) = 50 μm.

Plexiform layers in cardiovascular disruption model systems. (A,C) Cryosections of doubly-transgenic (cdh5:gal4; UAS:nfsB-mCherry), DMSO-treated (DMSO Control; (A); Met-treated (Endothelial Cell-Depleted; (B); and Met-treated clutchmates (Met Control; (C) at 72 hpf, stained with anti-Synaptic vesicle 2 (SV2), which stains synaptic terminals in inner and outer plexiform layers (IPL, OPL). Control retinas show well-defined plexiform layers (A, arrows), while endothelial cell-depleted retinas display a reduced and disorganized IPL and no clear OPL (B). (D,E) Cryosections of normal clutchmates (D) and sih–/– embryos (E) at 72 hpf, stained with anti-SV2. Normal retinas show well-defined plexiform layers (D), and sih–/– retinas also show well-defined plexiform layers, apparently reduced in thickness, with OPL also limited to the ventral half of the retina. Some of the reduced size appears proportional to the overall reduced eye size (E). (F,G) Cryosections of normal clutchmates (F) and vlt–/– embryos (G) at 72 hpf, stained with anti-SV2; the plexiform layers of vlt–/– retina appear normal. (H,J) Quantification of fraction of retina occupied by the IPL (IPL/retina ratio), in retinas of endothelial cell-depleted vs. control embryos (H; ***p < 0.001, **p < 0.01, Kruskal-Wallis with Conover post hoc; n = 8 DMSO control, 6 Met control, 9 endothelial cell-depleted), sih–/– vs. normal siblings (I; ***p < 0.001, Mann-Whitney test; n = 11 normal, 18 sih–/–), and vlt–/– vs. normal siblings (J; p = 0.0466, Mann-Whitney test; n = 15 for each condition). Scale bar (in A, applies to A-G) = 50 μm.

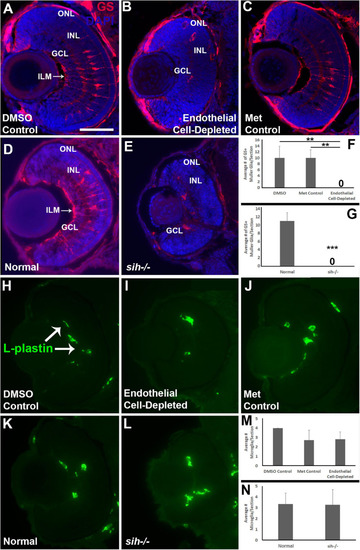
Müller glia and microglia in cardiovascular disruption model systems. (A–C) Cryosections of doubly-transgenic (cdh5:gal4; UAS:nfsB-mCherry), DMSO-treated (DMSO Control; (A); Met-treated (Endothelial Cell-Depleted; (B); and Met-treated clutchmates (Met Control; (C) at 72 hpf, stained with anti-Glutamine synthetase (GS; red fluorescence); GS is present within Müller glia, and counterstained with DAPI (blue). Control retinas show GS+ cell bodies within the INL, and GS+ Müller glial processes spanning the retina with a clear radial orientation and endfeet at the inner limiting membrane (ILM, arrow in A), while endothelial cell-depleted retinas display reduced GS staining, GS+ cell bodies in layers other than the INL, and a lack of GS+ endfeet at the ILM (B). (D,E) Cryosections of normal clutchmates (D) and sih–/– embryos (E) at 72 hpf, stained with anti-GS and DAPI. Normal retinas show normally-patterned GS+ Müller glial endfeet, cell bodies, and radial processes. The sih–/– retinas show far fewer GS+ cell bodies, and these are not positioned within the INL. (F,G) Quantification of GS+ cells with Müller glial morphology shows significantly fewer following endothelial cell depletion [(F); p < 0.01; Kruskal-Wallis with Conover post hoc test; n = 7 DMSO, 5 Met control, 6 endothelial cell-depleted], and in sih–/– compared with normal clutchmates [(G); ***p < 0.001; Mann-Whitney test, n = 8 for each condition] (H,J) Cryosections of doubly-transgenic (cdh5:gal4; UAS:nfsB-mCherry), DMSO-treated (DMSO Control; (H); Met-treated (Endothelial Cell-Depleted; I); and Met-treated clutchmates [(Met Control; (J)] at 72 hpf, stained with anti-L-plastin, which is a pan-leukocyte marker and stains microglia. Control retinas contain L-plastin+ microglia within the inner retina (H, arrows), and endothelial cell-depleted retinas also show microglia present within the inner retina (I). (K,L) Cryosections of normal clutchmates (K) and sih–/– embryos (L) at 72 hpf, stained with L-plastin, show similar patterns of staining. Scale bar (in A, applies to all images) = 50 μm. (M,N) Quantification of L-plastin+ microglia, in retinas of endothelial cell-depleted vs. control embryos [(M); p = 0.15; ANOVA with Tukey post hoc; n = 9 for each condition)], and sih–/– vs. normal siblings (N; p = 0.47; Student’s t-test; n = 7 for each condition).

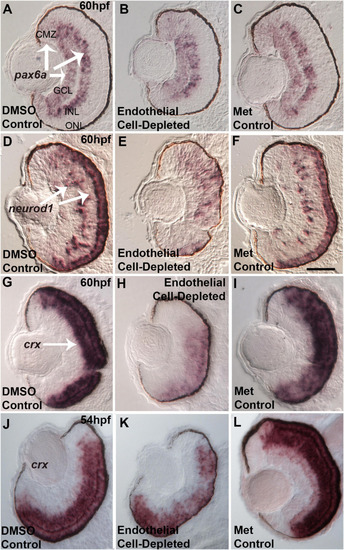
Selected retinal transcription factors in embryos depleted of vascular endothelial cells. (A–C) Cryosections of doubly-transgenic (cdh5:gal4; UAS:nfsB-mCherry), DMSO-treated (DMSO Control, n = 7; (A); Met-treated (Endothelial Cell-Depleted, n = 9; (B); and Met-treated clutchmates (Met Control, n = 8; (C) at 60 hpf, hybridized with probe targeting pax6a. Control retinas show pax6a expression within the ganglion cell layer (GCL), inner regions of the inner nuclear layer (INL), and ciliary marginal zone (CMZ) (A, arrows). Endothelial cell-depleted retinas display similar pax6a expression patterns (D,F). Same treatments as (A,C), but hybridized with probe targeting neurod1. Control retinas show neurod1 expression within the INL and outer nuclear layer (ONL) (D, arrows) (D, n = 6; E, n = 9; F, n = 9). Endothelial cell-depleted retinas display more diffuse expression, particularly in dorsal retina (E). (G–I) Same treatments as (A–C), but hybridized with probe targeting crx. Control retinas show crx expression within the outer INL and ONL (G, arrow). Endothelial cell-depleted retinas display weaker and more limited expression of crx(H) (G), n = 9; (H), n = 10; (I), n = 8). (J–L) Same treatments and crx probe as G.-I., but sampled at 54 hpf. Control retinas show crx expression within the outer INL and ONL (J). Endothelial cell-depleted retinas display patchier expression of crx(K) [(J), n = 5; (K), n = 6; (L), n = 6]. Scale bar in F (applies to all) = 25 μm.

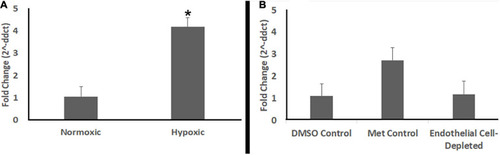
Endothelial cell-depleted embryos are not hypoxic. (A) Quantitative (real-time) RT-PCR (qPCR) of prolyl-hydroxylase3 (phd3) transcripts shows increased phd3 levels in experimentally hypoxic embryos vs. normoxic controls (*p < 0.05; Mann-Whitney Wilcoxon, using ddCts). (B) qPCR shows no increase in phd3 levels in Met-treated, doubly-transgenic (cdh5:gal4; UAS:nfsB-mCherry) vs. DMSO-treated, doubly-transgenic controls (p = 0.89; Kruskal-Wallis with Conover post hoc, using ddCts; n = 4 per condition, where each biological replicate includes 3-4 pooled embryos).

Acknowledgments
This image is the copyrighted work of the attributed author or publisher, and ZFIN has permission only to display this image to its users. Additional permissions should be obtained from the applicable author or publisher of the image. Full text @ Front Cell Dev Biol