IMAGE

FIGURE 11

ID
ZDB-IMAGE-210428-57
Source
Figures for Dhakal et al., 2021
Image
Figure Caption

FIGURE 11

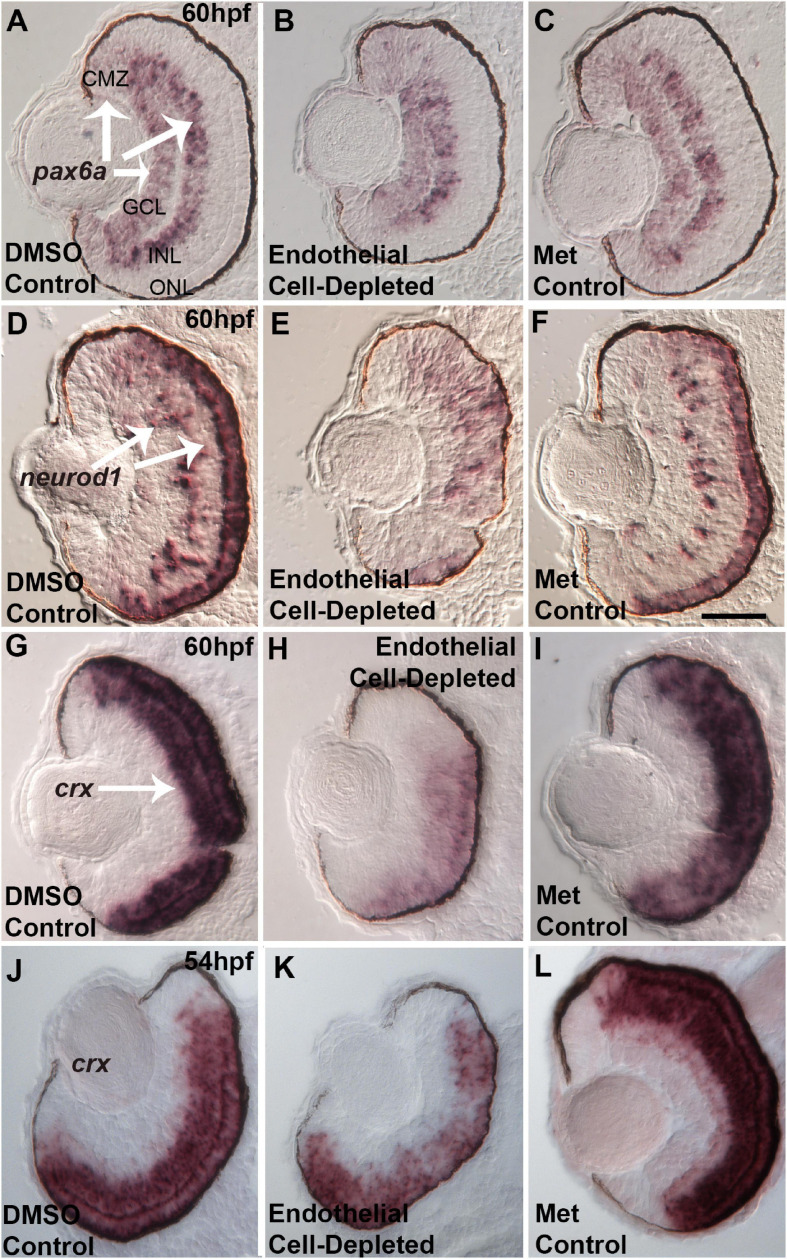
Selected retinal transcription factors in embryos depleted of vascular endothelial cells. (A–C) Cryosections of doubly-transgenic (cdh5:gal4; UAS:nfsB-mCherry), DMSO-treated (DMSO Control, n = 7; (A); Met-treated (Endothelial Cell-Depleted, n = 9; (B); and Met-treated clutchmates (Met Control, n = 8; (C) at 60 hpf, hybridized with probe targeting pax6a. Control retinas show pax6a expression within the ganglion cell layer (GCL), inner regions of the inner nuclear layer (INL), and ciliary marginal zone (CMZ) (A, arrows). Endothelial cell-depleted retinas display similar pax6a expression patterns (D,F). Same treatments as (A,C), but hybridized with probe targeting neurod1. Control retinas show neurod1 expression within the INL and outer nuclear layer (ONL) (D, arrows) (D, n = 6; E, n = 9; F, n = 9). Endothelial cell-depleted retinas display more diffuse expression, particularly in dorsal retina (E). (G–I) Same treatments as (A–C), but hybridized with probe targeting crx. Control retinas show crx expression within the outer INL and ONL (G, arrow). Endothelial cell-depleted retinas display weaker and more limited expression of crx(H) (G), n = 9; (H), n = 10; (I), n = 8). (J–L) Same treatments and crx probe as G.-I., but sampled at 54 hpf. Control retinas show crx expression within the outer INL and ONL (J). Endothelial cell-depleted retinas display patchier expression of crx(K) [(J), n = 5; (K), n = 6; (L), n = 6]. Scale bar in F (applies to all) = 25 μm.

Acknowledgments
This image is the copyrighted work of the attributed author or publisher, and ZFIN has permission only to display this image to its users. Additional permissions should be obtained from the applicable author or publisher of the image. Full text @ Front Cell Dev Biol