IMAGE

FIGURE 4

ID
ZDB-IMAGE-210428-83
Source
Figures for Dhakal et al., 2021
Image
Figure Caption

FIGURE 4

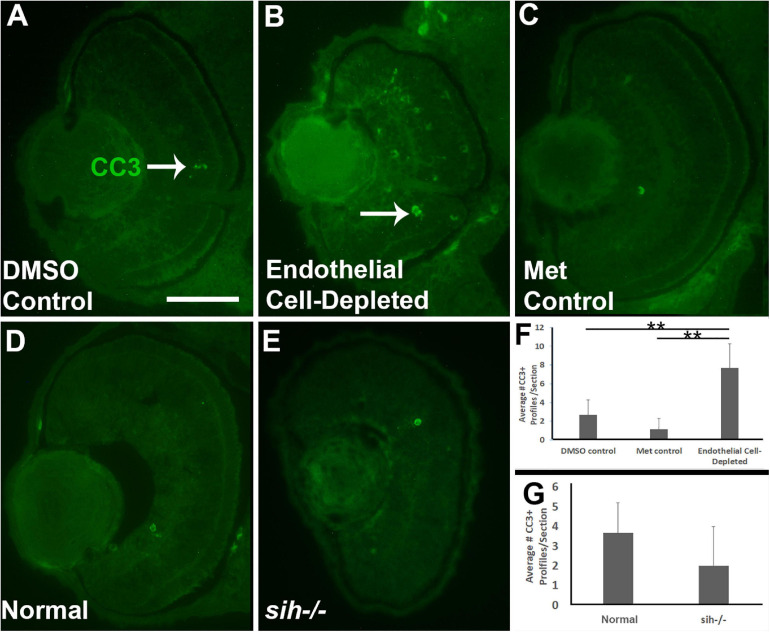
Retinal cell death in cardiovascular disruption model systems. (A,C) Cryosections of doubly-transgenic (cdh5:gal4; UAS:nfsB-mCherry), DMSO-treated (DMSO Control; (A); Met-treated (Endothelial Cell-Depleted; (B); and Met-treated clutchmates (Met Control; (C) at 72 hpf, stained with anti-activated caspase 3 (α-CC3). Control retinas show very few CC3+ profiles (arrow in A), while endothelial cell-depleted retinas display more widespread CC3+ stained-material (arrow in B), indicating cell death. (D,E) Cryosections of normal clutchmates (D) and sih–/– embryos (E), stained with α-CC3. Cell death appears not to be widespread in retinas of sih–/–. Scale bar (in A, applies to A–E) = 50 μm. (F,G) Quantification of CC3+ profiles in retinas of endothelial cell-depleted vs. control embryos (F; **p < 0.01, ANOVA with Tukey post hoc; n = 6 per condition) and sih–/– vs. WT embryos (G; p = 0.16, Student’s t-test; n = 6 per condition).

Acknowledgments
This image is the copyrighted work of the attributed author or publisher, and ZFIN has permission only to display this image to its users. Additional permissions should be obtained from the applicable author or publisher of the image. Full text @ Front Cell Dev Biol