FIGURE

FIGURE 5

ID
ZDB-FIG-210428-84
Publication
Dhakal et al., 2021 - Selective Requirements for Vascular Endothelial Cells and Circulating Factors in the Regulation of Retinal Neurogenesis
Other Figures
All Figure Page
Back to All Figure Page
FIGURE 5

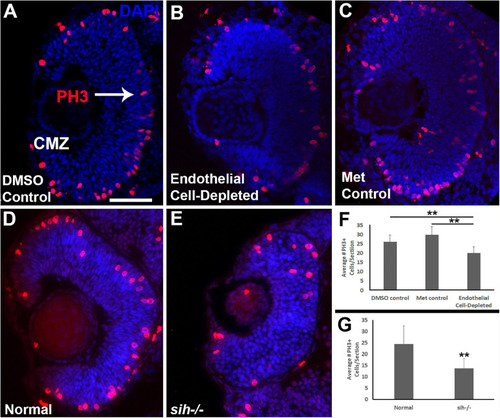
Retinal cell proliferation in cardiovascular disruption model systems. (A,C). Cryosections of doubly-transgenic (cdh5:gal4; UAS:nfsB-mCherry), DMSO-treated (DMSO Control; (A); Met-treated (Endothelial Cell-Depleted; (B); and Met-treated clutchmates (Met Control; (C) at 48 hpf, stained with anti-phosphohistone H3 (PH3; red fluorescence) and counterstained with DAPI (blue). Control retinas show numerous PH3+ profiles, particularly within apical retina (arrow in A) and the ciliary marginal zone (CMZ). Endothelial cell-depleted retinas also display apically-positioned PH3+ cells that appear to be reduced in number (B). (D,E) Cryosections of normal clutchmates (D) and sih–/– embryos (E), stained with α-PH3 and DAPI. Normal retinas show numerous PH3+ profiles while sih–/– retinas display fewer PH3+ cells. Scale bar (in A, applies to A–E) = 50 μm. (F,G) Quantification of PH3+ profiles in retinas of endothelial cell-depleted vs. control embryos (F; **p < 0.01 ANOVA with Tukey post hoc; n = 9 DMSO, 11 Met control, and 14 Endothelial cell-depleted) and sih–/– vs. normal siblings (G; **p < 0.01, Student’s t-test; n = 10 normal, 11 sih–/–).

Expression Data

Expression Detail
Antibody Labeling
Phenotype Data

Phenotype Detail
Acknowledgments
This image is the copyrighted work of the attributed author or publisher, and ZFIN has permission only to display this image to its users. Additional permissions should be obtained from the applicable author or publisher of the image. Full text @ Front Cell Dev Biol