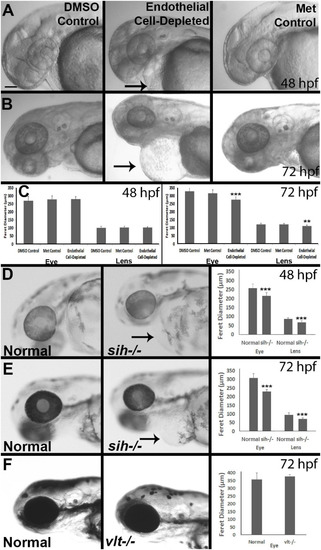
Eye and lens sizes in cardiovascular disruption model systems. (A,B) Live, doubly-transgenic (cdh5:gal4; UAS:nfsB-mCherry), DMSO-treated (DMSO Control), Met-treated (Endothelial Cell-Depleted), and Met-treated clutchmates (Met controls) viewed at 48 hpf (A) and 72 hpf (B). Arrows in middle panel of each indicate swollen epicardial sac. (C). Graphs show average (±s.d.) Feret diameter of eyes and lenses; statistical analysis by ANOVA and Tukey post hoc (48 hpf; n = 15 per condition) and Kruskal-Wallis and Conover’s post hoc (72 hpf; n = 15 DMSO, 14 Met control, and 12 Endothelial cell-depleted). (D,E) Live, normal clutchmates and sih–/– embryos viewed at 48 hpf (D) and 72 hpf (E). Arrows in second panel of each indicate swollen epicardial sac. Graphs in (D,E) show average (±s.d.) Feret diameter of eyes and lenses; statistical analyses by Student’s t-tests (48 hpf; n = 22 normal, 7 sih–/–) and Mann-Whitney test (72 hpf; n = 17 normal, 11 sih–/–). (F) Live, normal clutchmates and vlt–/– embryos viewed at 72 hpf. Graph in (F) shows average (±s.d.) Feret diameter of eyes; statistical analysis by Mann-Whitney test (p = 0.068; n = 12 normal, 13 vlt–/–). Scale bar (in (A), applies to all images) = 100 μm. Statistical notation: **p < 0.01; ***p < 0.001. Embryos in (A–E) were PTU-treated to prevent pigmentation from interfering with visualizing the lens.
|
