IMAGE

FIGURE 6

ID
ZDB-IMAGE-210428-85
Source
Figures for Dhakal et al., 2021
Image
Figure Caption

FIGURE 6

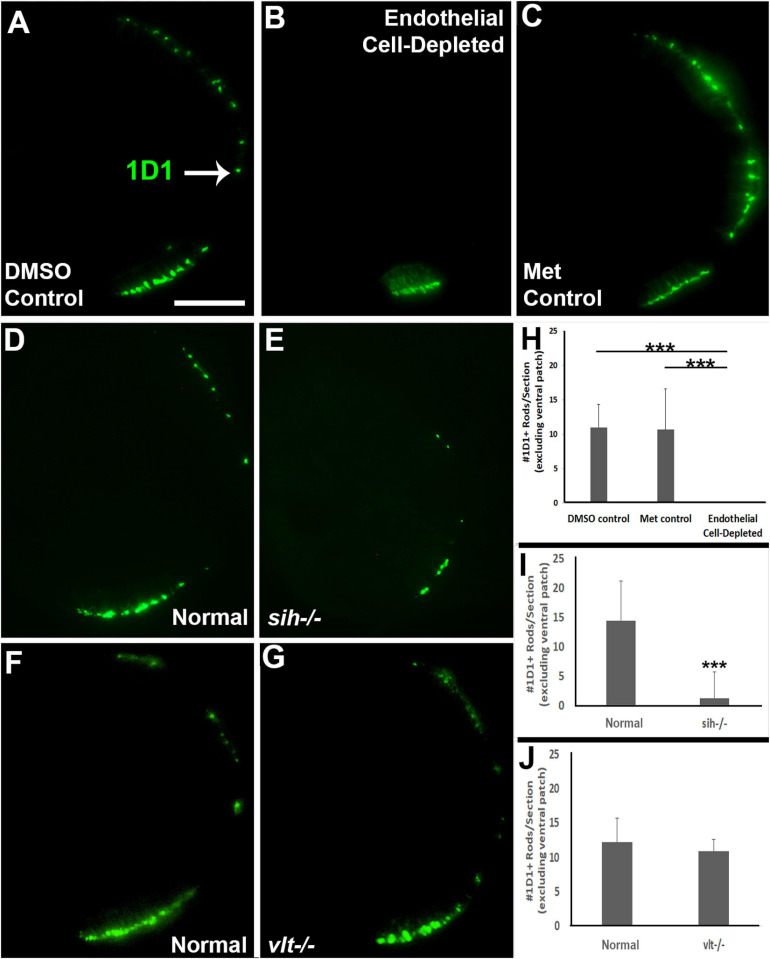
Rod photoreceptors in cardiovascular disruption model systems. (A,C) Cryosections of doubly-transgenic (cdh5:gal4; UAS:nfsB-mCherry), DMSO-treated (DMSO Control; (A); Met-treated (Endothelial Cell-Depleted; (B); and Met-treated clutchmates (Met Control; C) at 72 hpf, stained with 1D1, which labels Rhodopsin. Control retinas show numerous rods (A, arrow), while endothelial cell-depleted retinas display only a patch of rods in ventral retina (B). (D,E) Cryosections of normal clutchmates (D) and sih–/– embryos (E) at 72 hpf, stained with 1D1. Normal retinas show numerous 1D1+ profiles while sih–/– retinas show a reduced number of rods. (F,G) Cryosections of normal clutchmates (F) and vlt–/– embryos (G) at 72 hpf, stained with 1D1, show similar patterns of staining. Scale bar (in A, applies to A–G) = 50 μm. (H,J) Quantification of 1D1+ rods outside the ventral patch, in retinas of endothelial cell-depleted vs. control embryos (H; ***p < 0.001, Kruskal-Wallis with Conover post hoc; n = 6 per condition), sih–/– vs. normal siblings (I; ***p < 0.001, Mann-Whitney test; n = 12 normal, 19 sih–/–), and vlt–/– vs. normal siblings (J; p = 0.55 Student’s t-test; n = 9 normal, 8 vlt–/–).

Acknowledgments
This image is the copyrighted work of the attributed author or publisher, and ZFIN has permission only to display this image to its users. Additional permissions should be obtained from the applicable author or publisher of the image. Full text @ Front Cell Dev Biol