
- Title
-
Emx2 regulates hair cell rearrangement but not positional identity within neuromasts
- Authors
- Ohta, S., Ji, Y.R., Martin, D., Wu, D.K.
- Source
- Full text @ Elife
( |
( EXPRESSION / LABELING:
|
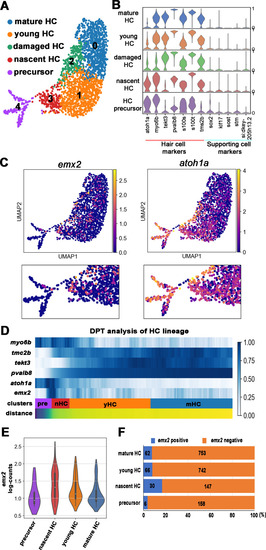
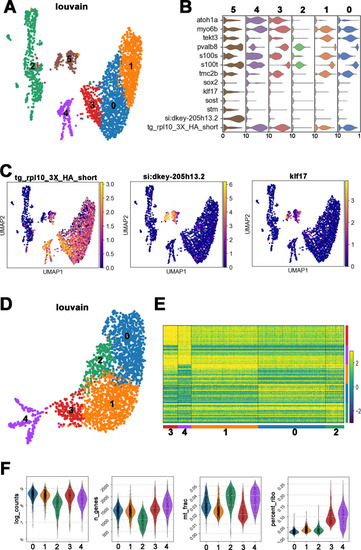
(A) Uniform manifold approximation and projection (UMAP) plot colored by Louvain clustering annotated with cell types in the HC lineage. (B) Violin plots of selected HC (red bar) and supporting cell (blue bar) marker genes in each cluster. (C) Distribution of cells expressing emx2 and atoh1a on UMAP. Clusters of precursors (#4) and nascent HCs (#3) are enlarged in bottom panels. (D) Heat map representation of selected gene expression dynamics in pseudotime. (E) A violin plot showing significantly higher read counts of emx2 in the nascent HC cluster than other clusters (p=0.0069, two tail Student's t-test, source data 1). (F) A bar graph showing a significantly higher number of emx2-positive cells in the nascent HC cluster than others (X2 = 22.44, df = 3, p<0.0001, source data 2). A post-hoc 2 × 2 chi-squared test was also performed for multiple comparisons: precursor HC cluster vs nascent HC cluster, X2 (df = 1)=15.92, p<0.0001; nascent HC cluster vs young HC cluster, X2 (df = 1)=12.73, p=0.0004; nascent HC cluster vs mature HC, X2 (df = 1)=15.08, p<0.0001. The following figure supplements are available for Figure 3—figure supplement 1. Identification and annotation of cell types from Louvain clustering. EXPRESSION / LABELING:
|
( |
( PHENOTYPE:
|
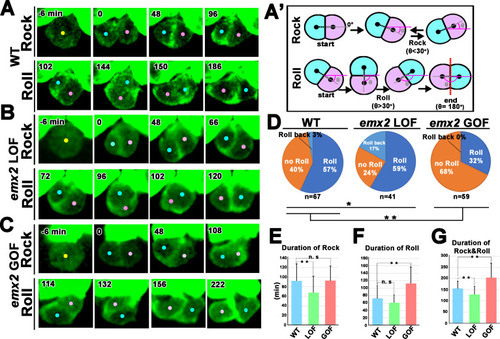
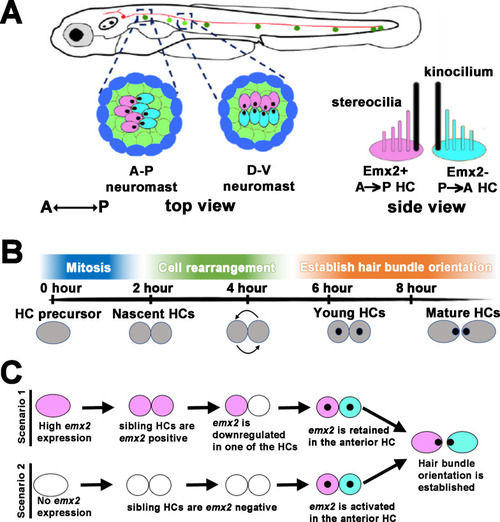
(A) In WT, a HC precursor (yellow dot) divides to form two daughter HCs (pink and blue dots), which first rock (Rock phase) and then frequently roll to exchange positions with each other (Roll phase). (A’) Definition of the Rock and Roll phase (see Materials and methods). (B and C) Compared to WT, emx2 loss of function (LOF) (B) and gain of function (GOF) (C) HC pairs took a shorter time in Rock and Roll and a longer time in the Roll phase, respectively. (D) Frequencies of Roll, No Roll, and Roll back of nascent HC pairs in WT (n = 67 from seven larvae), Emx2 LOF (n = 41 from six larvae), and GOF (n = 59 from seven larvae). Significance was assessed by using chi-squared test with 3 × 3 contingency table (X2 (df = 4)=30.00, p<0.0001, source data 1). A post-hoc 2 × 3 chi-squared test was performed for multiple comparisons. WT vs. LOF; (X2 (df = 2)=7.95, p=0.018), WT vs. GOF; (X2 (df = 2)=10.39, p=0.0055). Post-hoc chi-squared tests were performed for pairwise comparisons with FDR correction. (E–G) Duration of Rock (E), Roll (F), and Rock and Roll (G) of sibling HCs that underwent Rock and Roll in WT (n = 42), emx2 LOF (n = 35), and GOF (n = 19) larvae. Significance was assessed by using MANOVA (Rock, F(df1 = 2, df2 = 93)=5.349, p=0.0063, Wilks’ λ = 0.897; Roll, F(df1 = 2, df2 = 93)=15.638, p<0.0001, Wilks’ λ = 0.748; Rock and Roll, F(df1 = 2, df2 = 93)=20.10, p<0.0001, Wilks’ λ = 0.698), with post-hoc Tukey’s test for pairwise comparisons. *p<0.05, **p<0.01, n.s., not significant. |
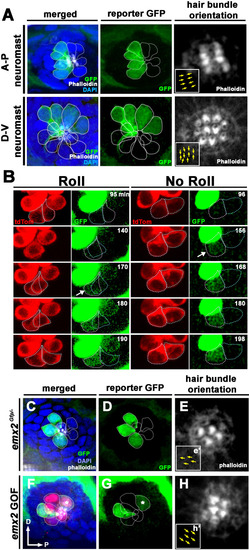
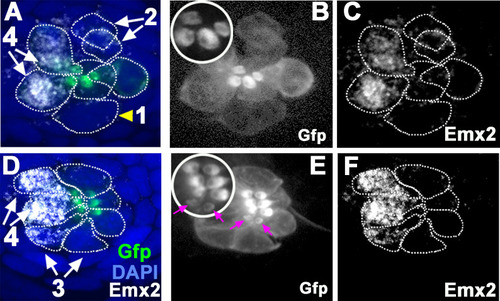
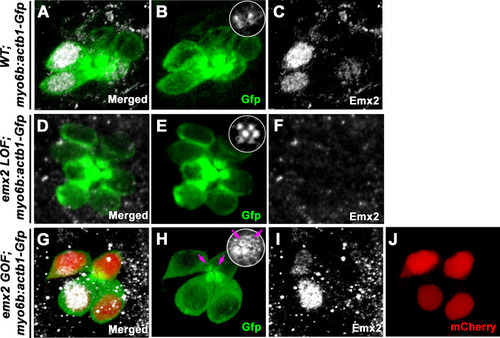
(A) In an emx2:Gfp zebrafish, Gfp-positive hair cells (HCs) are located in the anterior region of an A-P neuromast (top) and in the dorsal region of a D-V (bottom) neuromast. Phalloidin staining shows the hair bundle orientation (yellow arrows). (B) Time-lapse imaging of nascent HC pairs undergoing Roll or No Roll movement in emx2:Gfp; myo6b:dtTomato neuromasts. Left panel (Roll): A tdTomato-positive, nascent HC pair undergoing roll movement shows detectable Gfp expression in the posterior HC as it rolls into the anterior position (white arrow, 170 min into the Rock and Roll process). Right panel (No Roll): A HC pair that did not roll and Gfp appears in the anterior HC by 156 min into the Rock phase (white arrow). (C–E) The distribution of Gfp-positive HCs in an emx2gfp/- (loss of function [LOF]) neuromast, showing a merged image (C) of DAPI, GFP (D) and phalloidin staining (E). Outline of HCs are dotted. Gfp-positive HCs are located in the anterior region but hair bundles are pointing in P→A direction (yellow arrows in e’). (F–H) The distribution of Gfp-positive HCs in an emx2 gain of function (GOF);emx2Gfp/+ neuromast, showing a merged image (F) of DAPI, GFP (G), mCherry, and phalloidin staining (H). Among the total six pairs of GOF HCs analyzed, only two are Gfp-positive (G), one anterior- and one posterior (asterisk)-located. All hair bundles are in A→P direction (yellow arrows in h’). |
( |
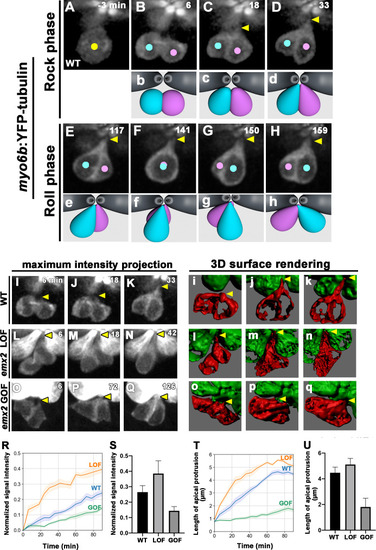
(A–H) Time-lapse images of myo6b:YFP-tubulin (wild-type [WT]) transgenic line showing nascent HCs undergoing Rock and Roll. After precursor cell divides (A), sibling HCs form an apical protrusion within 30 min of the Rock phase (B–D, yellow arrowhead, n = 6). When they exchange positions at the Roll phase, they appear to be pivoted at the apex (E–H, yellow arrowheads). Animation of images is shown in respective panels (Rock phase: b–d, Roll phase: e–h). (I–Q) Maximum intensity projection images generated by selected slices along z-axis in WT (I–K, same sample of A–H, n = 3), emx2 loss of function [LOF] (L–N, n = 3) and emx2 gain of function (GOF) (O–Q, n = 3). (i–q) Three-dimensional surface rendering of selected time points of live-imaging of HC pairs (red) in WT (i–k, n = 3), emx2 LOF (l–n, n = 3), and emx2 GOF (o–q, n = 3) neuromasts. Mature HCs are labeled in green. (R) Increases of YFP-tubulin signal intensity at the apical region of nascent HCs of WT (n = 5), emx2 LOF (n = 5), and emx2 GOF (n = 6) during the Rock phase (90 min). The shaded area represents the standard error of the mean (SEM). (S) YFP-tubulin signal intensities of the apical protrusion at the end of Rock phase were significantly different among WT (n = 5), emx2 LOF (n = 5), and emx2 GOF HCs (n = 6, one-way ANOVA, F = 26.97, p<0.0001); post-hoc Dunnett’s multiple comparisons test for WT vs. LOF, p=0.0073, WT vs. GOF, p=0.0052. (T) Increases over time in the length of apical protrusion in WT (n = 5), emx2 LOF (n = 5), and emx2 GOF (n = 5) during the Rock phase (90 min). The shaded area represents the SEM. (U) The length of apical protrusion at the end of the Rock phase in WT (n = 5), emx2 LOF (n = 5), and emx2 GOF (n = 5) were compared. Significance was assessed by using one-way ANOVA, F = 52.15, p<0.0001. Post-hoc Dunnett’s multiple comparisons test for WT vs. LOF is not significant (p=0.148) but significant for WT vs. GOF (p<0.0001). The following figure supplement, source data, videos are available for Figure 6—figure supplement 1. Measurements of signal intensity and length of the apical protrusion using Image J Fiji. |
( |
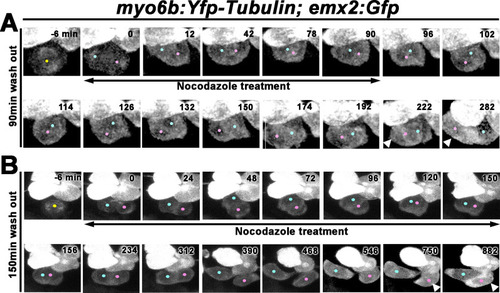
(A) Nascent sibling HCs in myo6b:Yfp-tubulin; emx2:Gfp larvae were treated with nocodazole for 90 min immediately after the HC precursor was observed to divide under live-imaging (0 min). After nocodazole removal, the nascent HC pair started to roll and they exchanged positions (96–174 min). The HC located at the anterior (pink dot) showed stronger Gfp signal due to the presence of emx2:Gfp and Yfp-tubulin alleles (222–282 min, arrowheads) than the emx2:Gfp-negative HC at the posterior (blue dot), which only expresses Yfp-tubulin. (B) Nascent HCs were treated with nocodazole for 150 min after HC precursor divided (0–150 min). After nocodazole removal, HCs failed to exchange their positions (156–312 min), which resulted in the mislocation of the emx2:Gfp-positive HC to the posterior (arrowheads, 618–882 min, pink dots). PHENOTYPE:
|
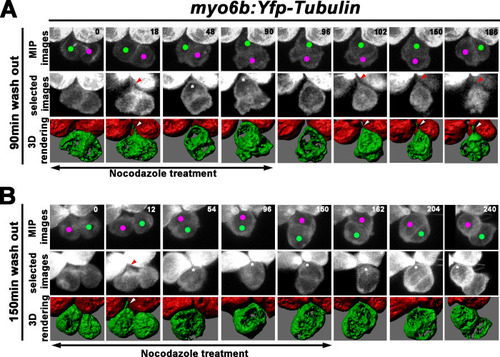
(A) Maximum intensity projection and 3-D rendering of selected images of nascent sibling HCs in myo6b:Yfp-tubulin larvae (magenta and green dots) that was treated with nocodazole for 90 min immediately after the precursor divided. The apical protrusion that normally forms within 18 min was still evident initially (18 min; red and white arrowheads) but disappeared quickly between 30 and 36 min (asterisks, 48 min). After nocodazole removal, the apical protrusion reappeared after 12 min (102 min, red and white arrowheads) and the two nascent HCs rolled to their respective positions after 84 min (186 min). (B) A nascent HC pair (red and green dots) that was treated with nocodazole for 150 min immediately after the precursor divided. Similar to 90 min treatments, the apical protrusion was evident between 12 and 18 min (12 min, red and white arrowheads) after HC precursor divided (0 min) but disappeared shortly within 30–36 min (54 min, asterisk). However, after nocodazole removal at 150 min, sibling HCs did not form an apical protrusion and exchange positions (162–240 min, asterisks). |
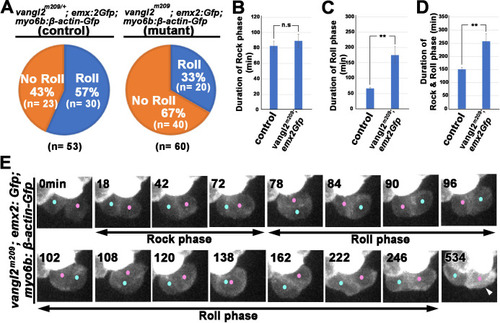
(A) Frequencies of Roll and No Roll of nascent hair cell (HC) pairs in control (vangl2m209/+; emx2gfp/+) and mutant (vangl2m209/m209; emx2gfp/+) larvae. Significance was assessed by using chi-squared test with a 2 × 2 contingency table (X2[(df = 1)]=6.1774, p<0.013, source data 1). (B–D) Duration of Rock (B), Roll (C), and Rock and Roll (D) of sibling HCs that underwent Rock and Roll in control (n = 28 from seven larvae) and vangl2m209/m209; emx2gfp/+ (n = 19 from seven larvae) larvae. Significance was assessed by using Student's t-test (*p<0.05, **p<0.001, source data 2). The error bars represent SEM. (E) Time-lapse images of a HC pair in trilobite (vangl2m209/m209); emx2gfp/+ mutant, which undergoes a prolong Roll phase from 78 to 246 min with several rolls (first roll: 78–96 min, second roll: 102–120 min, third partial roll: 138–162 min) and resulted in the emx2:Gfp-positive HC located to the posterior. The following figure supplement, source data, and video are available for Figure 9—figure supplement 1. Formation of apical protrusion in nascent HCs of trilobite. PHENOTYPE:
|
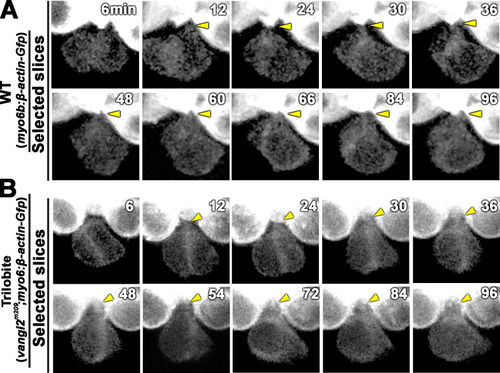
Time-lapse images of a nascent HC pair during Rock phase in ( |
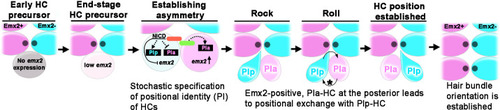
Unlike scenarios 1 and 2 illustrated in Figure 1C, our results show a model in which an end-stage HC precursor before division expresses low levels of |