
Figure 6
- ID
- ZDB-FIG-210119-29
- Publication
- Ohta et al., 2020 - Emx2 regulates hair cell rearrangement but not positional identity within neuromasts
- Other Figures
- All Figure Page
- Back to All Figure Page
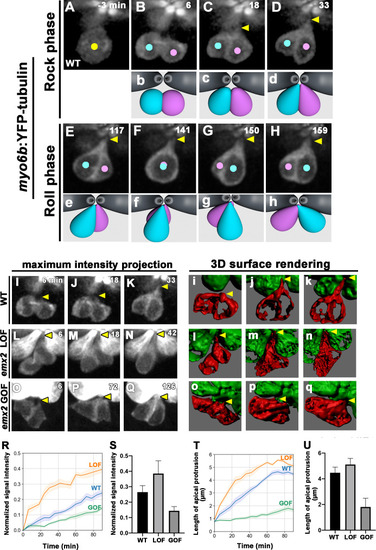
(A–H) Time-lapse images of myo6b:YFP-tubulin (wild-type [WT]) transgenic line showing nascent HCs undergoing Rock and Roll. After precursor cell divides (A), sibling HCs form an apical protrusion within 30 min of the Rock phase (B–D, yellow arrowhead, n = 6). When they exchange positions at the Roll phase, they appear to be pivoted at the apex (E–H, yellow arrowheads). Animation of images is shown in respective panels (Rock phase: b–d, Roll phase: e–h). (I–Q) Maximum intensity projection images generated by selected slices along z-axis in WT (I–K, same sample of A–H, n = 3), emx2 loss of function [LOF] (L–N, n = 3) and emx2 gain of function (GOF) (O–Q, n = 3). (i–q) Three-dimensional surface rendering of selected time points of live-imaging of HC pairs (red) in WT (i–k, n = 3), emx2 LOF (l–n, n = 3), and emx2 GOF (o–q, n = 3) neuromasts. Mature HCs are labeled in green. (R) Increases of YFP-tubulin signal intensity at the apical region of nascent HCs of WT (n = 5), emx2 LOF (n = 5), and emx2 GOF (n = 6) during the Rock phase (90 min). The shaded area represents the standard error of the mean (SEM). (S) YFP-tubulin signal intensities of the apical protrusion at the end of Rock phase were significantly different among WT (n = 5), emx2 LOF (n = 5), and emx2 GOF HCs (n = 6, one-way ANOVA, F = 26.97, p<0.0001); post-hoc Dunnett’s multiple comparisons test for WT vs. LOF, p=0.0073, WT vs. GOF, p=0.0052. (T) Increases over time in the length of apical protrusion in WT (n = 5), emx2 LOF (n = 5), and emx2 GOF (n = 5) during the Rock phase (90 min). The shaded area represents the SEM. (U) The length of apical protrusion at the end of the Rock phase in WT (n = 5), emx2 LOF (n = 5), and emx2 GOF (n = 5) were compared. Significance was assessed by using one-way ANOVA, F = 52.15, p<0.0001. Post-hoc Dunnett’s multiple comparisons test for WT vs. LOF is not significant (p=0.148) but significant for WT vs. GOF (p<0.0001). The following figure supplement, source data, videos are available for Figure 6—figure supplement 1. Measurements of signal intensity and length of the apical protrusion using Image J Fiji. |