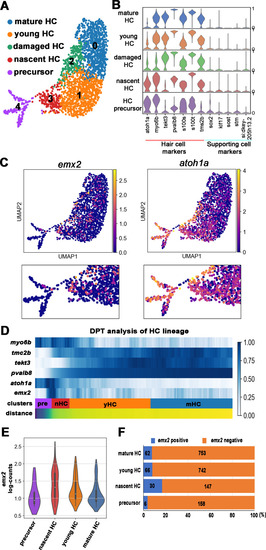
(A) Uniform manifold approximation and projection (UMAP) plot colored by Louvain clustering annotated with cell types in the HC lineage. (B) Violin plots of selected HC (red bar) and supporting cell (blue bar) marker genes in each cluster. (C) Distribution of cells expressing emx2 and atoh1a on UMAP. Clusters of precursors (#4) and nascent HCs (#3) are enlarged in bottom panels. (D) Heat map representation of selected gene expression dynamics in pseudotime. (E) A violin plot showing significantly higher read counts of emx2 in the nascent HC cluster than other clusters (p=0.0069, two tail Student's t-test, source data 1). (F) A bar graph showing a significantly higher number of emx2-positive cells in the nascent HC cluster than others (X2 = 22.44, df = 3, p<0.0001, source data 2). A post-hoc 2 × 2 chi-squared test was also performed for multiple comparisons: precursor HC cluster vs nascent HC cluster, X2 (df = 1)=15.92, p<0.0001; nascent HC cluster vs young HC cluster, X2 (df = 1)=12.73, p=0.0004; nascent HC cluster vs mature HC, X2 (df = 1)=15.08, p<0.0001. The following figure supplements are available for Figure 3—figure supplement 1. Identification and annotation of cell types from Louvain clustering.
|
