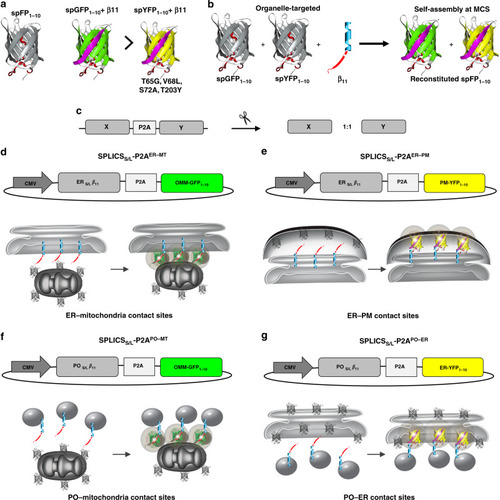
a Cartoon representation of GFP/YFP SPLICSS/L-P2A probes. The cartoon also indicates the occurrence of reconstitution of the two spectral variants through association with the invariant strand β11. b Schematic representation of the targeted GFP/YFP SPLICSS/L-P2A chimeras. GFP/YFP protein was split in two non-fluorescent portions, G(Y)FP1–10 and β11 fragment that are targeted to outer face of organelles of interest. The complementation of targeted split-GFP at membrane contact sites was also shown in the cartoon. c Creation of a single vector for the equimolar expression of the targeted fragments through the insertion of the P2A peptide. d–g Schematic representations of the SPLICSS/L-P2A vectors. The β11S/L coding sequence is cloned upstream the viral P2A peptide sequence, while the second cassette is occupied by the G(Y)FP1–10. d SPLICSS/L-P2AER–MT expression plasmids (ERS/L-β11 and OMM-GFP1–10). e SPLICSS/L-P2AER–PM expression plasmids (ERS/L-β11 and PM-YFP1–10). f SPLICSS/L-P2APO–MT expression plasmids (POS/L-β11 and OMM-GFP1–10). g SPLICSS/L-P2APO–ER expression plasmids (POS/L-β11 and ER-YFP1–10).
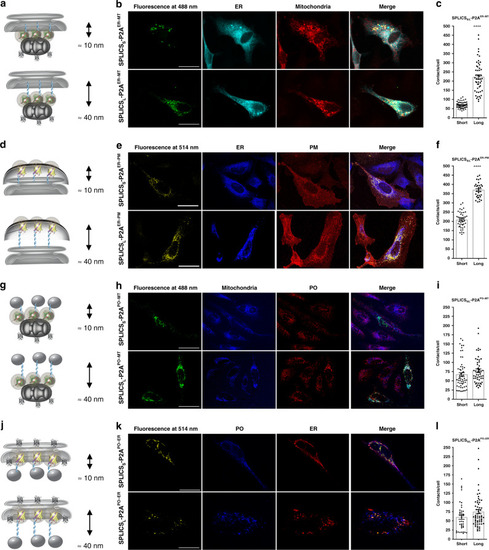
Functional characterization of the SPLICS<sub>S/L</sub>-P2A probes.
a, d, g, j Cartoon showing the short- and long-range contact sites measured by the indicated reporters. b, e, h, k Representative images of HeLa cells expressing the indicated SPLICSS/L-P2A probes to identify the co-localization of GFP (488 nm) or YFP (514 nm) fluorescent dots with targeted organelles. Different markers are used to label organelles: red fluorescent protein (mCherry) targeted to PM, anti-KDEL antibody (ER), mtHSP60 (mitochondria) and anti-PMP70 antibody (PO). Confocal images were acquired at 405, 488, 514, and 588 nm excitation wavelength. Scale bar 25 µm. c, f, i, l Quantification of the indicated SPLICSS/L-P2A (short and long) contacts in HeLa cells. The SPLICS dots were quantified from the 3D rendering of a complete Z-stack (see Supplementary Fig. 2), mean ± SEM. The data were obtained from three independent transfections. (****P ≤ 0.0001 unpaired two-tailed t-test). Source data are provided as a source data file.
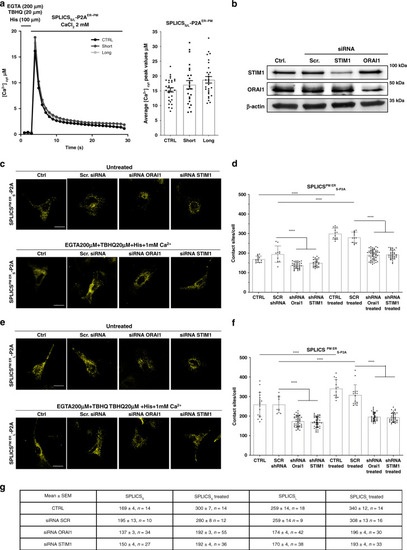
Deep proof-of-concept characterization of the ER–PM reporter.
a Cytosolic Ca2+ transients (left) and quantification (right) upon induction of the ER Ca2+ depletion in cells overexpressing SPLICSS-P2AER–PM and SPLICSL-P2AER–PM probes. To induce the ER Ca2+ depletion cells were treated with 20 µM 2,5-tertbutylhydroquinone (THBQ), 100 μM histamine, and 200 μM EGTA. Where indicated 2 mM CaCl2 was then applied to induce Ca2+ influx. The traces are the media of at least 15 independent measurements obtained from two independent transfections, mean ± SEM. b Expression levels of STIM1 and ORAI1 proteins in mock (Ctrl), siRNA scramble or siRNA STIM1, or SiRNA ORAI1 treated cells were analyzed by Western blotting with an anti-STIM1 or anti-ORAI1 antibodies. Equal amount of total loaded lysate was verified by incubation with anti-β actin antibody. Effect of STIM1/ORAI1 silencing and the ER Ca2+ depletion on short c and long e range contacts between the ER and PM. Representative microscope single plane images of HeLa cells expressing the SPLICSS/L-P2AER–PM untreated (top) or treated for 5 min (bottom) with 200 μM EGTA, 20 µM THBQ, 100 μM histamine, and then for additional 5 min with 1 mM CaCl2 supplemented to KRB. Scale bar 25 µm. Quantification of SPLICSS-P2AER–PMd and SPLICSL-P2AER–PMf contacts by 3D rendering of complete Z-stacks, mean ± SEM. The data were obtained from three independent transfections (****p ≤ 0.0001 unpaired two-tailed t-test). g Mean ± SEM values of the number of PM–ER contacts in control conditions, upon SOCE activation and upon siRNA scramble or siRNA STIM1 or SiRNA ORAI1 incubation. Source data are provided as a source data file.
Functional characterization of SPLICS<sub>S/L</sub> sensors to detect the ER–mitochondria and the ER–PM interfaces simultaneously.
a Schematic representation of the constructs SPLICSS/L P2AER–MT–PM able to detect short (8–10 nm) and long (40–50 nm) range contact sites between the ER–mitochondria and the ER–PM simultaneously in different spectral variants. The cartoon shows the approach used to design the SPLICS reporters and indicates that the complementation of either short- and long-range ER-β11 fragments with OMM-GFP1–10 and PM-YFP1–10 will reveal a florescence signal at the level of the contact sites. b, d Cartoon showing the short- and long-range contact sites measured by the indicated reporters. Confocal images of HeLa cells transfected with SPLICSS P2AER–MT–PMc and SPLICSL P2AER-MT-PMe showing the appearance of fluorescent “dots” upon excitation at 488 and 514 nm wavelengths confirming the complementation with GFP1–10 (in green) and YFP1–10 (in pseudocolour, red) at the ER–MT and the ER–PM contact sites, respectively. The co-localization of the SPLICSS/L P2AER–MT–PM reporters with PM-cherry (in cyan) as plasma membrane marker and with an endogenous marker of ER (KDEL, in magenta) (upper panels) and with mitochondria (TOM20, in cyan)/ER (KDEL, in magenta)/(lower panels) is shown. Scale bar 25 µm. Cytosolic f and mitochondrial g Ca2+ transients in cells overexpressing SPLICSS-P2AER–MT–PM and SPLICSL-P2AER–MT–PM probes, mean ± SEM. To induce ER Ca2+ depletion cells were incubated for 5 min in KRB supplemented with 100 nM thapsigargin, 100 μM histamine, 100 μM EGTA and then exposed, where indicated, to KRB containing 2 mM CaCl2. The traces are obtained from at least three independent transfections, values. h Quantification of the ER–mitochondria and the ER–PM (short and long) contacts in HeLa cells. The SPLICS dots were quantified from the 3D rendering of a complete Z-stack, mean ± SEM. The data were obtained from three independent transfections. (*P = 0.013, **P = 0.0052 one-way ANOVA). YFP emitted fluorescence is shown as pseudocolour in red to better appreciate in yellow the co-localization with the green signal of GFP. Source data are provided as a source data file.
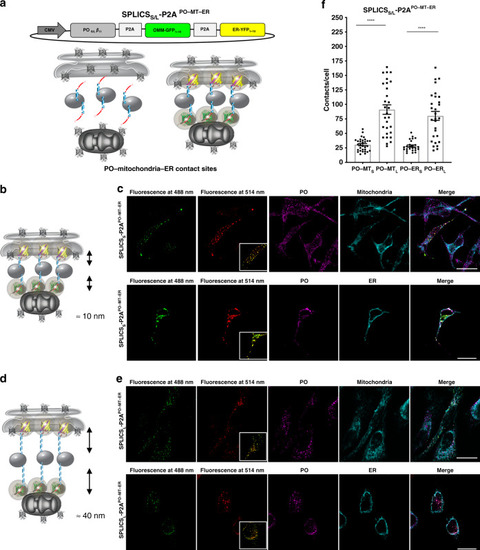
Functional characterization of SPLICS<sub>S/L</sub> sensors to detect the PO–mitochondria and the PO–ER interfaces simultaneously.
a Schematic representation of the constructs SPLICSS/L P2APO–MT–ER able to detect short (8–10 nm) and long (40–50 nm) range contact sites between the ER–mitochondria and the ER–PM simultaneously in different spectral variants. The cartoon shows the approach used to design the SPLICS reporters and indicates that the complementation of either short- and long-range PO-β11 fragments with OMM-GFP1–10 and ER-YFP1–10 will reveal a florescence signal at the level of the contact sites. b, d Cartoon showing the short- and long-range contact sites measured by the indicated reporters. Confocal single plane images of HeLa cells transfected with SPLICSS P2APO–MT–ERc and SPLICSL P2APO–MT–ERe showing the appearance of fluorescent “dots” upon excitation at 488 and 514 nm wavelengths confirming the complementation with GFP1–10 (in green) and YFP1–10 (in pseudocolour, red) at the PO–MT and the PO–ER contact sites, respectively. The co-localization of the SPLICSS/L P2APO–MT–ER reporters with endogenous markers of PO (PMP70)/mitochondria (TOM20) (upper panels) and PO (PMP70)/ER (KDEL) (lower panels) is shown. Scale bar 25 µm. f Quantification of the PO–mitochondria and the PO–ER (short and long) contacts in HeLa cells. The SPLICS dots were quantified from the 3D rendering of a complete Z-stack, mean ± SEM. The data were obtained from three independent transfections. (****P ≤ 0.0001 unpaired two-tailed t-test). Source data are provided as a source data file.
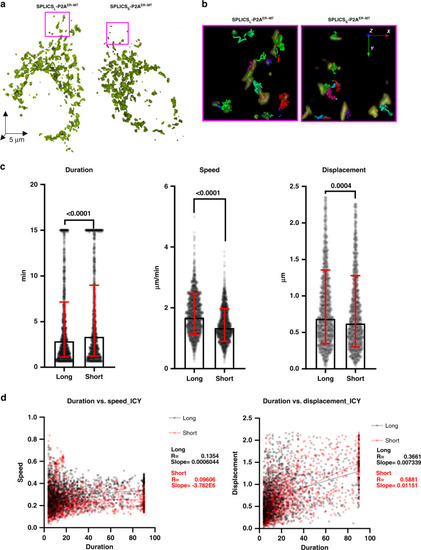
ER–mitochondria contact sites are dynamic structures in cultured cells.
a Representative rendering of HeLa cells expressing SPLICSS P2AER–MT (left panel) or SPLICSL P2AER–MT (right panel). b Representative isosurface rendering of tracks obtained by the Icy method of cropped areas from a. Tracks are color coded to represent track ID. c Tracks quantitative analysis obtained by the Icy method of track duration (n = 1645 long and 1504 short tracks from six cells), speed (n = 1671 long and 1502 short tracks from six cells) and displacement (n = 1461 long and 1395 short tracks from six cells), geometric mean ± geometric SD. d Duration/speed and Duration/displacement correlation obtained by the Icy method. The Parson coefficient and the slope are indicated for the long- and short-range ER–mitochondria contact sites, respectively. Data shown are the result of three independent transfections. (Mann–Whitney or Kolmgorov–Smirnov tests). Source data are provided as a source data file.
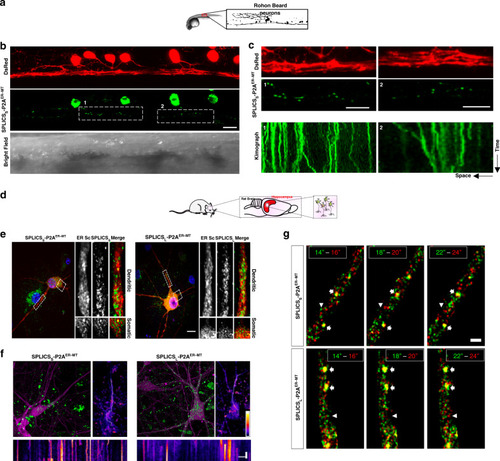
ER–mitochondria contact sites are dynamic structures in vivo.
a Live imaging of ER–mitochondria contact sites in zebrafish RB neurons. b Representative confocal images of SPLICSS-P2AER–MT in RB neurons of 24 hpf s1102t:GAL4 living embryos injected with the pT2-DsRed-UAS-SPLICSS-P2AER–MT construct. Rostral is on the right, dorsal on the top. BF Bright Field. c Magnification of the areas shown in b and kymographs obtained by time-lapse recordings of the indicated region of the cell. The width of the kymograph represents the length of the axon recorded during the time-lapse, whereas the height reflects the elapsed time. Scale bar: 15 μm. d Monitoring of ER–mitochondria contacts in rat hippocampal neurons by SPLICSS/L-P2AER–MT. e ER–mitochondria wide and narrow contact sites are distributed throughout the entire somatodendritic and axonal compartments in hippocampal neurons. Rat hippocampal neurons were co-transfected on DIV 11 with the endoplasmic reticulum marker ER-mScarlet (ER-Sc) together with either the short- (8–10 nm) or long-range (40–50 nm) sensors, SPLICSs-P2AER–MT (left) or SPLICSL- P2AER–MT (right), respectively. On DIV 12, neurons were incubated with Hoechst 33258 and fixed before confocal imaging. High-resolution Z-stacks were acquired in order to visualize nuclei (blue), ER (red), and ER–mitochondria contact sites (green). Selected dendritic (up) and somatic (bottom) regions are zoomed and shown on the right for a detailed view. Scale bar represents 10 µm. f Short- or long-range SPLICSS/L-P2AER–MT (green) were transduced on DIV 7 with rAAVs to convey sparse expression of RFP (magenta)34 and on DIV 11 neurons were transferred to an imaging chamber containing CO2-independent CICM medium and a Z-stack was acquired in a spinning disk microscope and shown as Z-stack maximum projection for a general overview (upper-left panels). By using a single plane, a time series of the SPLICSL/S structures was acquired during 4 min at 0.5 Hz. Standard deviation analysis was applied to the image (upper-right panels, scale bars represent 10 μm and the color table), which was used to identify mobile structures and to choose the path for its visualization in a kymograph (lower panels). The scale bars represent 60 s (vertical) and 10 μm (horizontal). g ER–mitochondria contact sites dynamics suggest high turnover rates in hippocampal neurons under basal unstimulated conditions. Rat hippocampal neurons were infected on DIV 7 with rAAVs to convey expression of the long- or short-range SPLICSL/S (green and red). On DIV 11, neurons were transferred to an imaging chamber containing CO2-independent medium and a time series was acquired in a spinning disk microscope at 0.5 Hz (same neurons shown in Fig. 7f). Three examples of two consecutive time points spanning 2 s in between are shown in the combined images, where the green and red colors indicate the initial and final time points, respectively. Arrows indicate hot-spots of long-lived SPLICSER–MT signals and arrowheads indicate short-lived SPLICSER–MT. The scale bar represents 2 μm. (The Image in panel d is a previously created element from Servier Medical Art https://smart.servier.com under the Creative Commons Attribution 3.0 Unported License).
Acknowledgments
This image is the copyrighted work of the attributed author or publisher, and
ZFIN has permission only to display this image to its users.
Additional permissions should be obtained from the applicable author or publisher of the image.
Full text @ Nat. Commun.
Your Input Welcome
Thank you for submitting comments. Your input has been emailed to ZFIN curators who may contact you if
additional information is required.
Oops. Something went wrong. Please try again later.