|
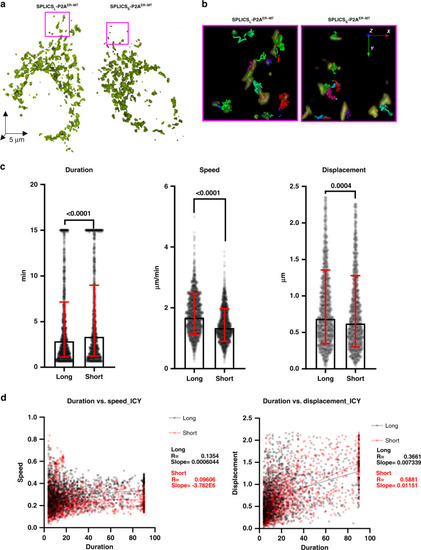
ER–mitochondria contact sites are dynamic structures in cultured cells.a Representative rendering of HeLa cells expressing SPLICSS P2AER–MT (left panel) or SPLICSL P2AER–MT (right panel). b Representative isosurface rendering of tracks obtained by the Icy method of cropped areas from a. Tracks are color coded to represent track ID. c Tracks quantitative analysis obtained by the Icy method of track duration (n = 1645 long and 1504 short tracks from six cells), speed (n = 1671 long and 1502 short tracks from six cells) and displacement (n = 1461 long and 1395 short tracks from six cells), geometric mean ± geometric SD. d Duration/speed and Duration/displacement correlation obtained by the Icy method. The Parson coefficient and the slope are indicated for the long- and short-range ER–mitochondria contact sites, respectively. Data shown are the result of three independent transfections. (Mann–Whitney or Kolmgorov–Smirnov tests). Source data are provided as a source data file.
|