|
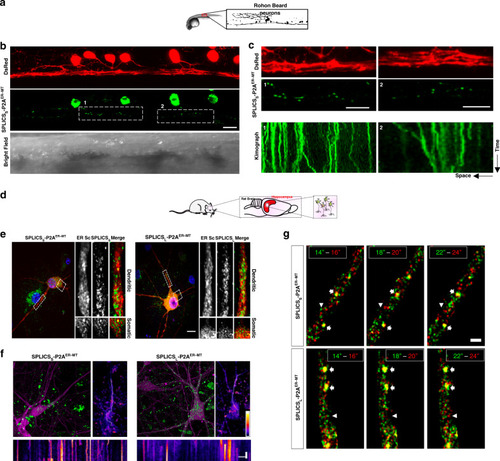
ER–mitochondria contact sites are dynamic structures in vivo.a Live imaging of ER–mitochondria contact sites in zebrafish RB neurons. b Representative confocal images of SPLICSS-P2AER–MT in RB neurons of 24 hpf s1102t:GAL4 living embryos injected with the pT2-DsRed-UAS-SPLICSS-P2AER–MT construct. Rostral is on the right, dorsal on the top. BF Bright Field. c Magnification of the areas shown in b and kymographs obtained by time-lapse recordings of the indicated region of the cell. The width of the kymograph represents the length of the axon recorded during the time-lapse, whereas the height reflects the elapsed time. Scale bar: 15 μm. d Monitoring of ER–mitochondria contacts in rat hippocampal neurons by SPLICSS/L-P2AER–MT. e ER–mitochondria wide and narrow contact sites are distributed throughout the entire somatodendritic and axonal compartments in hippocampal neurons. Rat hippocampal neurons were co-transfected on DIV 11 with the endoplasmic reticulum marker ER-mScarlet (ER-Sc) together with either the short- (8–10 nm) or long-range (40–50 nm) sensors, SPLICSs-P2AER–MT (left) or SPLICSL- P2AER–MT (right), respectively. On DIV 12, neurons were incubated with Hoechst 33258 and fixed before confocal imaging. High-resolution Z-stacks were acquired in order to visualize nuclei (blue), ER (red), and ER–mitochondria contact sites (green). Selected dendritic (up) and somatic (bottom) regions are zoomed and shown on the right for a detailed view. Scale bar represents 10 µm. f Short- or long-range SPLICSS/L-P2AER–MT (green) were transduced on DIV 7 with rAAVs to convey sparse expression of RFP (magenta)34 and on DIV 11 neurons were transferred to an imaging chamber containing CO2-independent CICM medium and a Z-stack was acquired in a spinning disk microscope and shown as Z-stack maximum projection for a general overview (upper-left panels). By using a single plane, a time series of the SPLICSL/S structures was acquired during 4 min at 0.5 Hz. Standard deviation analysis was applied to the image (upper-right panels, scale bars represent 10 μm and the color table), which was used to identify mobile structures and to choose the path for its visualization in a kymograph (lower panels). The scale bars represent 60 s (vertical) and 10 μm (horizontal). g ER–mitochondria contact sites dynamics suggest high turnover rates in hippocampal neurons under basal unstimulated conditions. Rat hippocampal neurons were infected on DIV 7 with rAAVs to convey expression of the long- or short-range SPLICSL/S (green and red). On DIV 11, neurons were transferred to an imaging chamber containing CO2-independent medium and a time series was acquired in a spinning disk microscope at 0.5 Hz (same neurons shown in Fig. 7f). Three examples of two consecutive time points spanning 2 s in between are shown in the combined images, where the green and red colors indicate the initial and final time points, respectively. Arrows indicate hot-spots of long-lived SPLICSER–MT signals and arrowheads indicate short-lived SPLICSER–MT. The scale bar represents 2 μm. (The Image in panel d is a previously created element from Servier Medical Art https://smart.servier.com under the Creative Commons Attribution 3.0 Unported License).
|