IMAGE

Fig. 4

ID
ZDB-IMAGE-201216-8
Source
Figures for Vallese et al., 2020
Image
Figure Caption

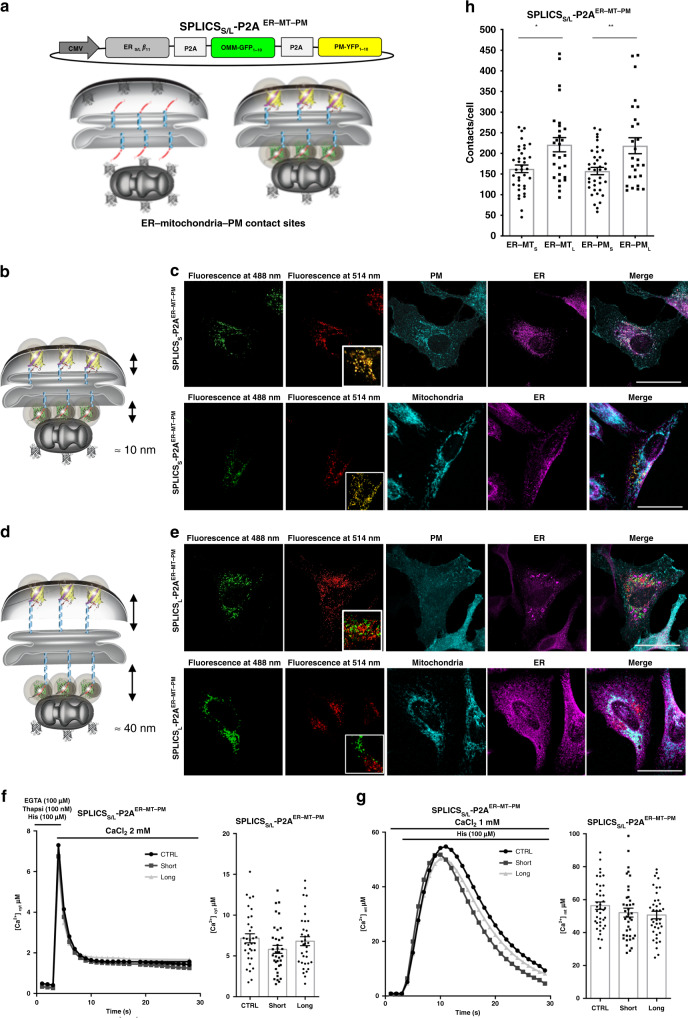
Fig. 4 Functional characterization of SPLICS<sub>S/L</sub> sensors to detect the ER–mitochondria and the ER–PM interfaces simultaneously.

a Schematic representation of the constructs SPLICSS/L P2AER–MT–PM able to detect short (8–10 nm) and long (40–50 nm) range contact sites between the ER–mitochondria and the ER–PM simultaneously in different spectral variants. The cartoon shows the approach used to design the SPLICS reporters and indicates that the complementation of either short- and long-range ER-β11 fragments with OMM-GFP1–10 and PM-YFP1–10 will reveal a florescence signal at the level of the contact sites. b, d Cartoon showing the short- and long-range contact sites measured by the indicated reporters. Confocal images of HeLa cells transfected with SPLICSS P2AER–MT–PMc and SPLICSL P2AER-MT-PMe showing the appearance of fluorescent “dots” upon excitation at 488 and 514 nm wavelengths confirming the complementation with GFP1–10 (in green) and YFP1–10 (in pseudocolour, red) at the ER–MT and the ER–PM contact sites, respectively. The co-localization of the SPLICSS/L P2AER–MT–PM reporters with PM-cherry (in cyan) as plasma membrane marker and with an endogenous marker of ER (KDEL, in magenta) (upper panels) and with mitochondria (TOM20, in cyan)/ER (KDEL, in magenta)/(lower panels) is shown. Scale bar 25 µm. Cytosolic f and mitochondrial g Ca2+ transients in cells overexpressing SPLICSS-P2AER–MT–PM and SPLICSL-P2AER–MT–PM probes, mean ± SEM. To induce ER Ca2+ depletion cells were incubated for 5 min in KRB supplemented with 100 nM thapsigargin, 100 μM histamine, 100 μM EGTA and then exposed, where indicated, to KRB containing 2 mM CaCl2. The traces are obtained from at least three independent transfections, values. h Quantification of the ER–mitochondria and the ER–PM (short and long) contacts in HeLa cells. The SPLICS dots were quantified from the 3D rendering of a complete Z-stack, mean ± SEM. The data were obtained from three independent transfections. (*P = 0.013, **P = 0.0052 one-way ANOVA). YFP emitted fluorescence is shown as pseudocolour in red to better appreciate in yellow the co-localization with the green signal of GFP. Source data are provided as a source data file.

Acknowledgments
This image is the copyrighted work of the attributed author or publisher, and ZFIN has permission only to display this image to its users. Additional permissions should be obtained from the applicable author or publisher of the image. Full text @ Nat. Commun.