|
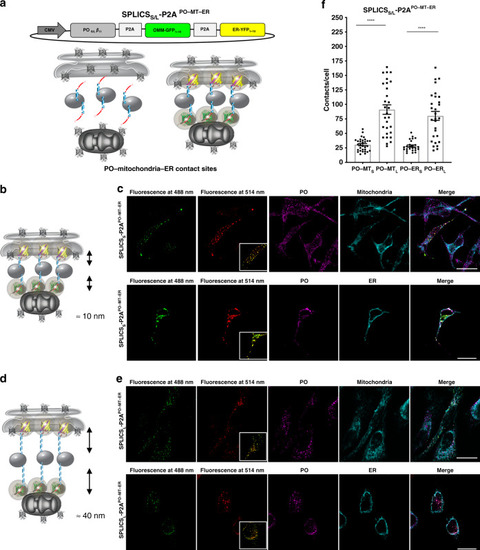
Functional characterization of SPLICS<sub>S/L</sub> sensors to detect the PO–mitochondria and the PO–ER interfaces simultaneously.a Schematic representation of the constructs SPLICSS/L P2APO–MT–ER able to detect short (8–10 nm) and long (40–50 nm) range contact sites between the ER–mitochondria and the ER–PM simultaneously in different spectral variants. The cartoon shows the approach used to design the SPLICS reporters and indicates that the complementation of either short- and long-range PO-β11 fragments with OMM-GFP1–10 and ER-YFP1–10 will reveal a florescence signal at the level of the contact sites. b, d Cartoon showing the short- and long-range contact sites measured by the indicated reporters. Confocal single plane images of HeLa cells transfected with SPLICSS P2APO–MT–ERc and SPLICSL P2APO–MT–ERe showing the appearance of fluorescent “dots” upon excitation at 488 and 514 nm wavelengths confirming the complementation with GFP1–10 (in green) and YFP1–10 (in pseudocolour, red) at the PO–MT and the PO–ER contact sites, respectively. The co-localization of the SPLICSS/L P2APO–MT–ER reporters with endogenous markers of PO (PMP70)/mitochondria (TOM20) (upper panels) and PO (PMP70)/ER (KDEL) (lower panels) is shown. Scale bar 25 µm. f Quantification of the PO–mitochondria and the PO–ER (short and long) contacts in HeLa cells. The SPLICS dots were quantified from the 3D rendering of a complete Z-stack, mean ± SEM. The data were obtained from three independent transfections. (****P ≤ 0.0001 unpaired two-tailed t-test). Source data are provided as a source data file.
|