|
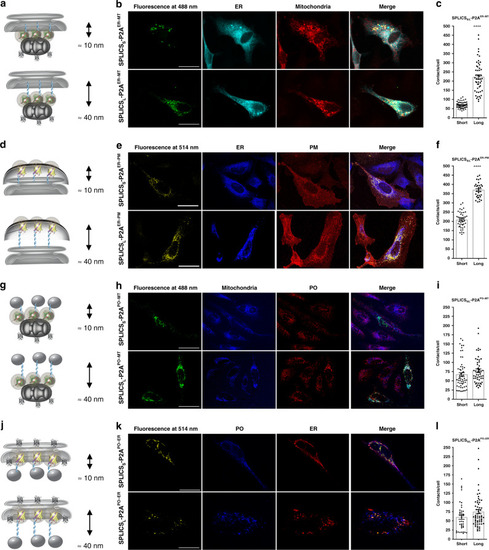
Functional characterization of the SPLICS<sub>S/L</sub>-P2A probes.a, d, g, j Cartoon showing the short- and long-range contact sites measured by the indicated reporters. b, e, h, k Representative images of HeLa cells expressing the indicated SPLICSS/L-P2A probes to identify the co-localization of GFP (488 nm) or YFP (514 nm) fluorescent dots with targeted organelles. Different markers are used to label organelles: red fluorescent protein (mCherry) targeted to PM, anti-KDEL antibody (ER), mtHSP60 (mitochondria) and anti-PMP70 antibody (PO). Confocal images were acquired at 405, 488, 514, and 588 nm excitation wavelength. Scale bar 25 µm. c, f, i, l Quantification of the indicated SPLICSS/L-P2A (short and long) contacts in HeLa cells. The SPLICS dots were quantified from the 3D rendering of a complete Z-stack (see Supplementary Fig. 2), mean ± SEM. The data were obtained from three independent transfections. (****P ≤ 0.0001 unpaired two-tailed t-test). Source data are provided as a source data file.
|