
- Title
-
Emergence of Neuronal Diversity during Vertebrate Brain Development
- Authors
- Raj, B., Farrell, J.A., Liu, J., El Kholtei, J., Carte, A.N., Navajas Acedo, J., Du, L.Y., McKenna, A., Relić, Đ., Leslie, J.M., Schier, A.F.
- Source
- Full text @ Neuron
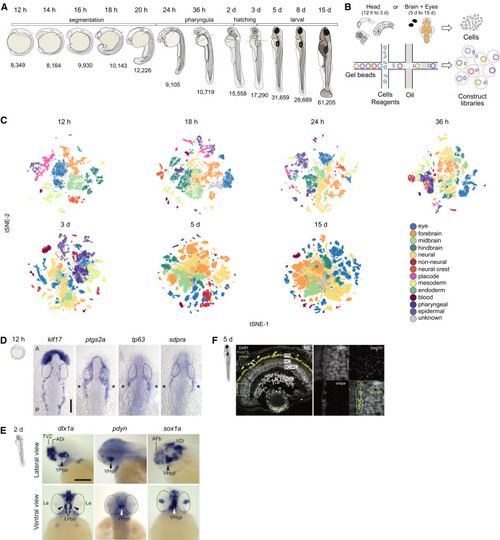
Figure 1. Developmental Compendium of Zebrafish Head and Brain Cell Types (A) Schematic of the developmental stages profiled. Red hatched line, head regions selected for enrichment of brain cells. Samples from 5 to 15 dpf were dissected to obtain brain and eye specifically. h, hours post fertilization; d, days post fertilization (B) Schematic of scRNA-seq using the 10X Genomics platform. (C) Cell type heterogeneity within each stage. Clusters at each stage were assigned to a region or tissue type based on known markers and color coded to reflect their classification. tSNE implementations: Barnes-Hut (12 h to 3 d), Fourier transform (5 d and 15 d). (D) In situ hybridization for novel markers in the trigeminal placode at 12 hpf. klf17 is expressed on the anterior polster and ventral mesoderm, delineating the border of the embryo. Trigeminal ganglia markers ptgs2a, tp63, and sdpra (cavin2a) are expressed bilaterally (asterisks) posterior to the eye. Eyes are delineated by dotted lines. A: Anterior; P: Posterior. Scale bar, 100 μm. (E) In situ hybridization validation of novel marker sox1a in the hypothalamus at 2 dpf. Top panels, lateral view of brain; Bottom panels, ventral view of brain. dlx1a and pdyn are known hypothalamic markers. Eyes are delineated by dotted lines. VHyp: Ventral Hypothalamus; TVZ: Telencephalic Ventricular Zone; ADi: Anterior Diencephalon; AFb: Anterior Forebrain; VDi: Ventral Diencephalon; Le: Lens. Scale bar, 200 μm. (F) smFISH validation of novel marker ompa in horizontal cells of the retina at 5 dpf. Left panel, retina section stained with DAPI (gray), pan-retinal foxg1b (cyan) and ompa (yellow). Strong yellow signal in photoreceptors represent autofluorescence. White box, area zoomed in for the right panels. Dotted lines, horizontal cell layer. PR, photoreceptor cells; HC, horizontal cells; BC, bipolar cells; AC, amacrine cells; RGC, retinal ganglion cells EXPRESSION / LABELING:
|
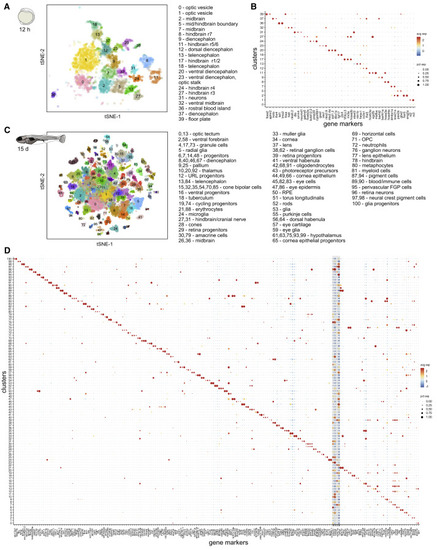
Figure 2. Brain Cell Type Diversification from 12 hpf to 15 dpf (A) tSNE plot of 12 hpf dataset. Only clusters corresponding to neural and blood cell types are shown. Inferred identities of each cluster are described. (B) Dot plot of gene expression pattern of select marker genes (columns) for each cluster (row). Dot size indicates the percentage of cells expressing the marker; color represents the average scaled expression level. (C) tSNE plot of 15 dpf dataset. Inferred identities of each cluster are described. (D) Dot plot of gene expression patterns of select marker genes for each cluster. Layout is same as (B). Grey box represents generic neuronal and progenitor genes. tSNE implementations: Barnes-Hut (A), Fourier transform (C) |

Figure 3. Neuron Subtype Diversity at 15 dpf (A–C) Violin plots of select marker gene expression in identified brain neuron subtypes at 15 dpf. Retinal neurons and nascent neurons are omitted from the analysis. Cluster numbers are indicated at the bottom along with their inferred spatial location in the brain. Cluster 76 has unknown spatial location. Detailed cluster descriptions are in Table S1 and can be explored interactively at https://github.com/brlauuu/zf_brain. (A) Expression of transcription factors. (B) Expression of neuropeptides and their receptors. (C) Expression of genes involved in neuron electrophysiology. (D) Matrix showing overlap of neuron subtypes identified at 15 dpf and earlier larval (5 and 8 dpf) or later juvenile (25 dpf [Raj et al., 2018b]) stages. The cluster number at 15 dpf is shown, and an orange circle indicates that the subtype is detected in another stage. |
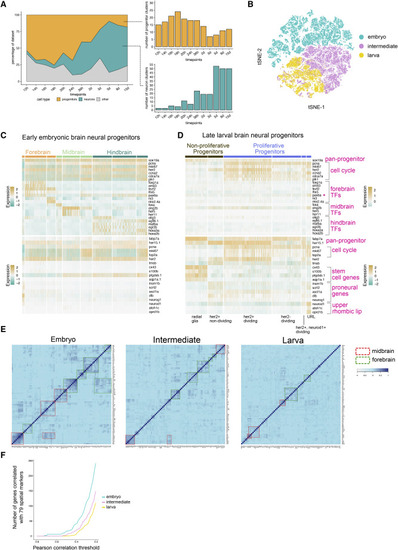
Figure 4. Developmental Diversification of Neurons and Progenitors (A) Area plot of the percentage of dataset at each time point corresponding to neural progenitors, neurons, and other cell types. Right panels, total number of clusters of progenitors and neurons at each stage. (B) tSNE plot of embryonic, intermediate, and larval neural progenitors. All progenitor cells were analyzed together after subsetting from the whole dataset. (C and D) Heatmaps of select gene expression in early embryonic (C) and late larval (D) brain neural progenitors. Top panel, genes enriched in embryonic progenitors. Bottom panel, genes enriched in larval progenitors. TF, transcription factor. ∗pax6a is expressed in multiple regions (E) Heatmap of Pearson correlation values of 79 spatial markers in embryonic, intermediate, and larval neural progenitors. Spatial markers were selected based on existing literature. Groups of co-varying genes in the midbrain and forebrain are highlighted with dashed boxes. (F) Plot of highly variable genes that co-vary with any of the selected 79 spatial markers in embryonic and larval progenitors. Co-variation was determined by Pearson correlation, with several thresholds (from stringent to relaxed) displayed along the x axis. |

Figure 5. Optimization of scGESTALT Lineage Recorder for Better Barcode Recovery (A) Schematic overview of CRISPR-Cas9 lineage recording. Optimized scGESTALT comprises a barcode cassette in the 3′end of DsRed transgene (single copy) and the medaka beta-actin promoter. Embryos were injected with Cas9 protein and DsRed sgRNAs, and animals were profiled at 15 dpf by scRNA-seq. (B) Pairwise comparisons using cosine dissimilarity of barcode edit patterns from four (ZF1–ZF4) edited 15 dpf larval brains. (C) Chord diagram of the nature and frequency of deletions within and between target sites. Each colored sector represents a target site. Links between target sites represent inter-site deletions; self-links represent intra-site deletions. Link widths are proportional to the edit frequencies. (D) Type of edit at each target site within the barcode from edited ZF1–ZF4 larval brains. (E) Heatmap of lineage relationships between non-retinal and retinal cell types in the eye. All clusters with >3 cells and all barcodes with >1 cell were used to determine if there is enrichment of cell-type-specific barcodes across each cluster pair. Blue indicates significant enrichment and lineage segregation. Purple indicates no significant enrichment and no lineage segregation. Grey indicates insufficient sampling power and undefined lineage status. Cluster numbers are indicated (e.g., C45) and either cell type gene markers (e.g., cldna+) or the exact name of the cell type (e.g., cone bipolar cells) are indicated along the rows. Along the columns, the numbers within the brackets indicate the number of barcodes and number of cells, respectively, for that cluster. (F) Heatmap of lineage relationships between brain regions and the retina. Neuron clusters that could be pseudospatially assigned to each region were used (see Table S1). Analysis, layout, and color code are same as in (E). (G) Heatmap of lineage relationships between neuronal cell types in the forebrain and midbrain. Analysis, layout, and color code are same as in (E). Clusters were assigned to a brain region (e.g., pallium, hypothalamus), and for clusters where a more precise location could not be inferred, a gene marker is indicated (e.g., pitx2+). (H) Heatmap of lineage relationships between brain progenitor clusters. Analysis, layout, and color code is same as in (E). Cell type marker genes are indicated along with the cluster number. URL, upper rhombic lip (I) Bar plot of the proportion (based on Jaccard Index) of granule cell (cerebellum neurons) barcodes that are shared with each brain progenitor cluster. Cluster numbers are the same as in (H). |
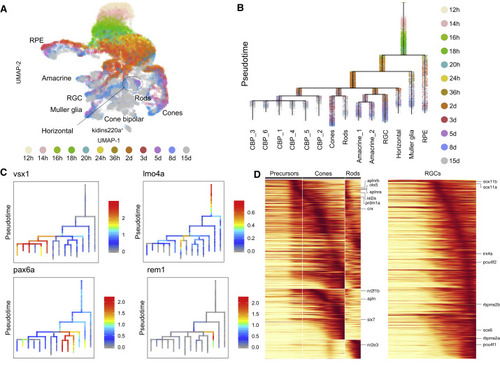
Figure 6. Cell Specification Trajectories in the Retina (A) UMAP visualization of retinal cell types. Retinal cells (based on clustering analysis) from 12 hpf to 15 dpf were subsetted from the full dataset and analyzed together. Cells are color coded by stage. (B) Cell specification tree of zebrafish retinal development. Trajectories were generated by URD and visualized as a branching tree. Cells are color coded by stage. 12 hpf cells were assigned as the root, and 15 dpf differentiated cells were assigned as tips. CBP, cone bipolar cells (6 subtypes are numbered); RGC, retinal ganglion cells; RPE, retinal pigment epithelium (C) Expression of select genes are shown on the retina specification tree. (D) Heatmaps of gene expression cascades of photoreceptor cell trajectories and retinal ganglion cell trajectories. Cells were selected based on high expression along trajectories leading to these cell types, compared to expression along opposing branchpoints. Red, high expression. Yellow, low expression |
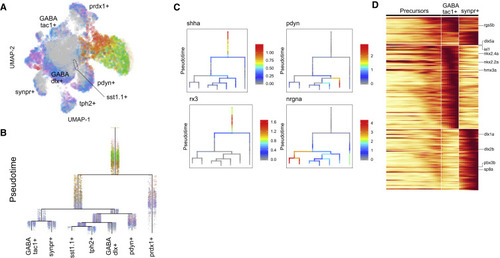
Figure 7. Cell Specification Trajectories in the Hypothalamus (A) UMAP visualization of hypothalamus cell types. Hypothalamus cells (based on clustering analysis) from 12 hpf to 15 dpf were subsetted from the full dataset and analyzed together. Cells are color coded by stage. (B) Cell specification tree of zebrafish hypothalamus development. Trajectories were generated by URD and visualized as a branching tree. Cells are color coded by stage. 12 hpf cells were assigned as the root, and 15 dpf differentiated cells were assigned as tips. (C) Expression of select genes are shown on the hypothalamus specification tree. (D) Heatmap of gene expression cascade of nrgna+ cell trajectories. Red, high expression. Yellow, low expression. |
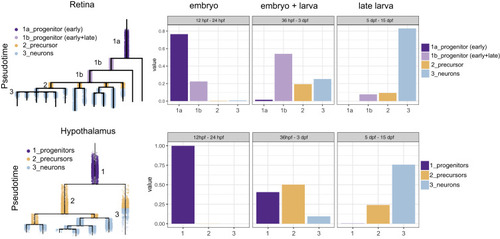
Figure 8. Progenitor Differences between Retina and Hypothalamus Retinal and hypothalamus cells were divided into progenitor (purple), precursor (orange), and differentiated (blue) cells, as shown on the URD tree. The fraction of cells in each of these transcriptional states was then determined for three developmental periods (12–24 hpf, 36 hpf–3 dpf, and 5–15 dpf). In the retina, cells can be found in a progenitor state (light purple) that persists post-embryonically. |

ZFIN is incorporating published figure images and captions as part of an ongoing project. Figures from some publications have not yet been curated, or are not available for display because of copyright restrictions. |