
Fig. 4
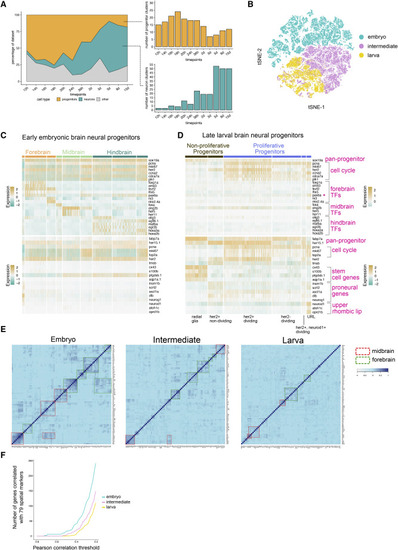
Figure 4. Developmental Diversification of Neurons and Progenitors (A) Area plot of the percentage of dataset at each time point corresponding to neural progenitors, neurons, and other cell types. Right panels, total number of clusters of progenitors and neurons at each stage. (B) tSNE plot of embryonic, intermediate, and larval neural progenitors. All progenitor cells were analyzed together after subsetting from the whole dataset. (C and D) Heatmaps of select gene expression in early embryonic (C) and late larval (D) brain neural progenitors. Top panel, genes enriched in embryonic progenitors. Bottom panel, genes enriched in larval progenitors. TF, transcription factor. ∗pax6a is expressed in multiple regions (E) Heatmap of Pearson correlation values of 79 spatial markers in embryonic, intermediate, and larval neural progenitors. Spatial markers were selected based on existing literature. Groups of co-varying genes in the midbrain and forebrain are highlighted with dashed boxes. (F) Plot of highly variable genes that co-vary with any of the selected 79 spatial markers in embryonic and larval progenitors. Co-variation was determined by Pearson correlation, with several thresholds (from stringent to relaxed) displayed along the x axis. |