
Fig. 6
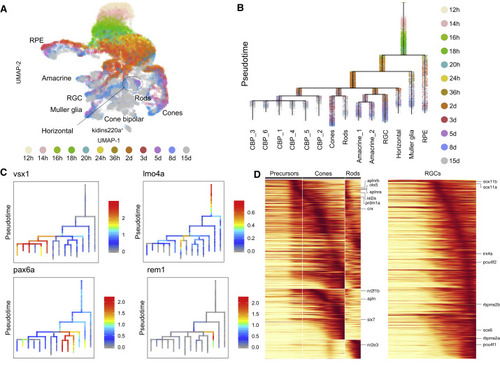
Figure 6. Cell Specification Trajectories in the Retina (A) UMAP visualization of retinal cell types. Retinal cells (based on clustering analysis) from 12 hpf to 15 dpf were subsetted from the full dataset and analyzed together. Cells are color coded by stage. (B) Cell specification tree of zebrafish retinal development. Trajectories were generated by URD and visualized as a branching tree. Cells are color coded by stage. 12 hpf cells were assigned as the root, and 15 dpf differentiated cells were assigned as tips. CBP, cone bipolar cells (6 subtypes are numbered); RGC, retinal ganglion cells; RPE, retinal pigment epithelium (C) Expression of select genes are shown on the retina specification tree. (D) Heatmaps of gene expression cascades of photoreceptor cell trajectories and retinal ganglion cell trajectories. Cells were selected based on high expression along trajectories leading to these cell types, compared to expression along opposing branchpoints. Red, high expression. Yellow, low expression |