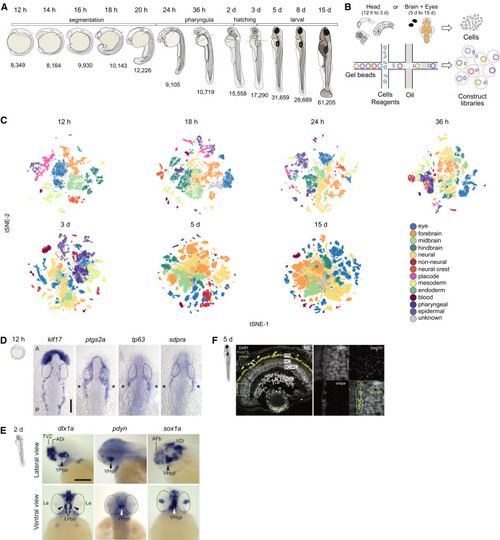
Figure 1. Developmental Compendium of Zebrafish Head and Brain Cell Types (A) Schematic of the developmental stages profiled. Red hatched line, head regions selected for enrichment of brain cells. Samples from 5 to 15 dpf were dissected to obtain brain and eye specifically. h, hours post fertilization; d, days post fertilization (B) Schematic of scRNA-seq using the 10X Genomics platform. (C) Cell type heterogeneity within each stage. Clusters at each stage were assigned to a region or tissue type based on known markers and color coded to reflect their classification. tSNE implementations: Barnes-Hut (12 h to 3 d), Fourier transform (5 d and 15 d). (D) In situ hybridization for novel markers in the trigeminal placode at 12 hpf. klf17 is expressed on the anterior polster and ventral mesoderm, delineating the border of the embryo. Trigeminal ganglia markers ptgs2a, tp63, and sdpra (cavin2a) are expressed bilaterally (asterisks) posterior to the eye. Eyes are delineated by dotted lines. A: Anterior; P: Posterior. Scale bar, 100 μm. (E) In situ hybridization validation of novel marker sox1a in the hypothalamus at 2 dpf. Top panels, lateral view of brain; Bottom panels, ventral view of brain. dlx1a and pdyn are known hypothalamic markers. Eyes are delineated by dotted lines. VHyp: Ventral Hypothalamus; TVZ: Telencephalic Ventricular Zone; ADi: Anterior Diencephalon; AFb: Anterior Forebrain; VDi: Ventral Diencephalon; Le: Lens. Scale bar, 200 μm. (F) smFISH validation of novel marker ompa in horizontal cells of the retina at 5 dpf. Left panel, retina section stained with DAPI (gray), pan-retinal foxg1b (cyan) and ompa (yellow). Strong yellow signal in photoreceptors represent autofluorescence. White box, area zoomed in for the right panels. Dotted lines, horizontal cell layer. PR, photoreceptor cells; HC, horizontal cells; BC, bipolar cells; AC, amacrine cells; RGC, retinal ganglion cells
|
