
Fig. 7
- ID
- ZDB-IMAGE-210217-67
- Publication
- Raj et al., 2020 - Emergence of Neuronal Diversity during Vertebrate Brain Development
- All Figures
- Figures for Raj et al., 2020
|
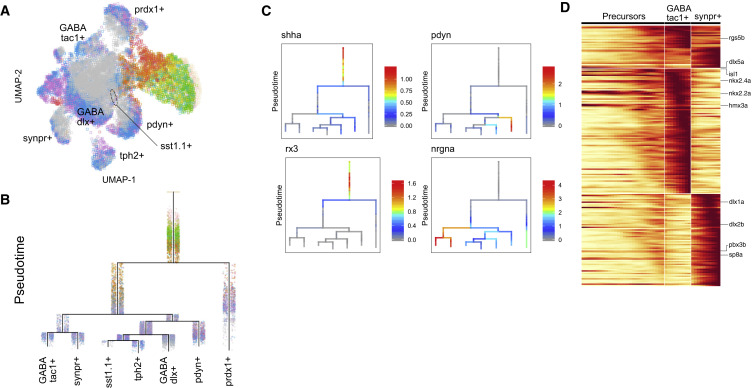
Fig. 7 Figure 7. Cell Specification Trajectories in the Hypothalamus (A) UMAP visualization of hypothalamus cell types. Hypothalamus cells (based on clustering analysis) from 12 hpf to 15 dpf were subsetted from the full dataset and analyzed together. Cells are color coded by stage. (B) Cell specification tree of zebrafish hypothalamus development. Trajectories were generated by URD and visualized as a branching tree. Cells are color coded by stage. 12 hpf cells were assigned as the root, and 15 dpf differentiated cells were assigned as tips. (C) Expression of select genes are shown on the hypothalamus specification tree. (D) Heatmap of gene expression cascade of nrgna+ cell trajectories. Red, high expression. Yellow, low expression.