- Title
-
Loss of Sbds in zebrafish leads to neutropenia and pancreas and liver atrophy
- Authors
- Oyarbide, U., Shah, A.N., Amaya-Mejia, W., Snyderman, M., Kell, M., Allende, D., Calo, E., Topczewski, J., Corey, S.
- Source
- Full text @ JCI Insight

ZFIN is incorporating published figure images and captions as part of an ongoing project. Figures from some publications have not yet been curated, or are not available for display because of copyright restrictions. EXPRESSION / LABELING:
PHENOTYPE:
|
|
(A) Survival rates for siblings of sbdsnu132. (B) Rescue of sbds mutants: Western blot showing Sbds from fins of adult fish with the indicated different genotypes. Note that the transgenic line expresses Sbds of a slightly bigger mass, due to an inadvertently introduced initiation codon upstream of the coding sequence. We took advantage of this 23–amino acid tag to distinguish between endogenous and exogenously introduced Sbds. Actin is shown as a control for protein loading. (C) Survival analysis, which demonstrates the rescue of sbdsnu132/nu132 by the transgenic line Tg(ubiloxP:sbdsloxP:GFP) N = 50; sbdsnu132/nu132. (D) Images of 10, 15, and 21 dpf larvae from the same clutch: sbds+/+ and sbdsnu132/nu132. Scale bars: 200 μm (10 dpf), 500 μm (15 dpf), 1000 μm (sbds+/+ 21 dpf), and 500 μm (sbdsnu132/nu132 21 dpf). (E) Size variability of mutants (sbdsnu132 and sbdsnu167) in the first 21 dpf. Fin regeneration 48 hours after amputation (hpa) in fish that are (F) 15 dpf (N = 30) and (G) 21 dpf, which shows less regeneration (N = 42). (H) Representative images of the fins 48 hpa in 21 dpf larvae for sbds+/+ and sbdsnu132/nu132. The sbdsnu132/nu132 mutants possess a decreased number of neutrophils. Original magnification, ×6.3. (I) Presence of neutrophils at 15 dpf in sbds+/+ and sbdsnu132/nu132 using the Tg(mpx:Dendra2)uw4. Original magnification, ×20. Number of neutrophils (J) at 5 and (K) at 15 dpf; N = 59 and N = 96, respectively. ANOVA test. *P < 0.05, **P < 0.001, ***P < 0.0001. EXPRESSION / LABELING:
PHENOTYPE:
|
|
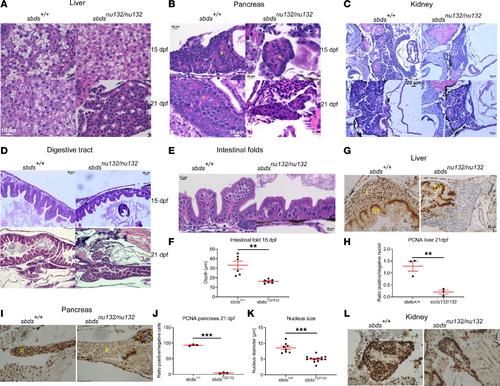
H&E staining of (A) liver, showing no differences between sbds+/+ and sbdsnu132/nu132 at 15 dpf and liver fibrosis in sbds mutants at 21 dpf (original magnification, ×40); (B) pancreas, showing reduction of zymogen granules (yellow stars) (original magnification, ×40); (C) kidney and (D) digestive tract, showing a reduction in folds’ depth at 15 dpf and a constriction at 21 dpf in sbds mutants (original magnification, ×20); (E) intestinal folds at higher magnification (original magnification, ×40); and (F) quantitative differences in the depths of the epithelial folds. Immunohistochemistry for proliferation using PCNA in (G) liver at 21 dpf; (H) ratio of PCNA+ nuclei to total nuclei in the liver; (I) immunohistochemistry of pancreas, with blue star denoting the islet, at 21 dpf; and (J) ratio of PCNA+ nuclei to total nuclei in the pancreas and (K) kidney; no differences were detected in the ratios of positive nuclei to total nuclei (data not shown). (L) Quantification of the nucleus size in pancreatic acinar cells of sbds mutants versus WT siblings. *P < 0.05, **P < 0.001, ***P < 0.0001, t test. DT, digestive tract; L, liver; P, pancreas. EXPRESSION / LABELING:
PHENOTYPE:
|
|
(A) Oil Red O (ORO) staining for neutral lipid accumulation: different groups depending on ORO staining. Red arrow shows lipid accumulation in the blood vessels; lipid droplets are indicated by a black arrow. (B) Size distribution and genotypes depending on the ORO staining. Colored lines show the mean SL for each group. (C) Gene expression of lipid metabolism markers in 15 dpf larvae. Statistical analysis was performed using the t test. *P < 0.05. EXPRESSION / LABELING:
PHENOTYPE:
|

ZFIN is incorporating published figure images and captions as part of an ongoing project. Figures from some publications have not yet been curated, or are not available for display because of copyright restrictions. EXPRESSION / LABELING:
PHENOTYPE:
|
|
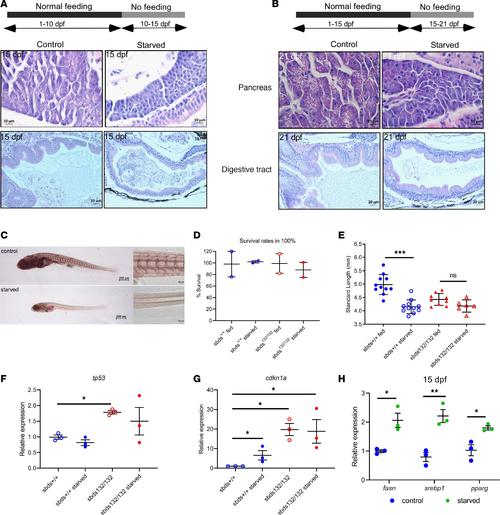
(A and B) H&E staining of pancreas and digestive tract in starvation assays. (C) ORO staining for lipid accumulation in starved and fed fish for 10–15 or 15–21 dpf. A model of starvation was performed to determine size distribution and fin regeneration. Scale bars: 500 μm (left), 50 μm (right). (D) Survival rates and (E) size distribution in WT and mutants after starvation. Expression of (F) tp53 and (G) cdk1a show a dysregulation of cdkn1a in starved mutants. (H) Gene expression of lipid metabolism markers in starved WT fish. Statistical analysis was performed using the ANOVA and t test. *P < 0.05, **P < 0.001, ***P < 0.0001. EXPRESSION / LABELING:
PHENOTYPE:
|

Unillustrated author statements PHENOTYPE:
|


