FIGURE

Fig. 6

ID
ZDB-FIG-200924-37
Publication
Oyarbide et al., 2020 - Loss of Sbds in zebrafish leads to neutropenia and pancreas and liver atrophy
Other Figures
All Figure Page
Back to All Figure Page
Fig. 6

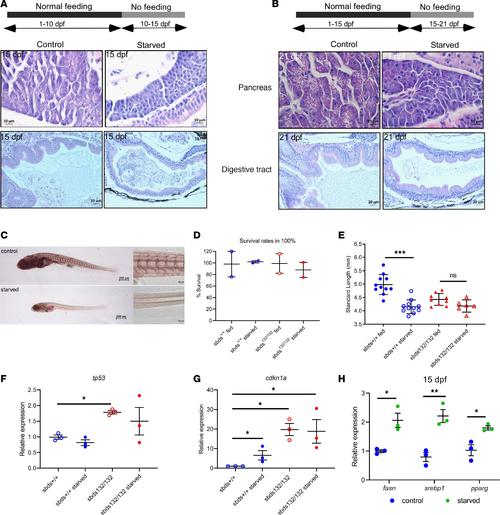
(A and B) H&E staining of pancreas and digestive tract in starvation assays. (C) ORO staining for lipid accumulation in starved and fed fish for 10–15 or 15–21 dpf. A model of starvation was performed to determine size distribution and fin regeneration. Scale bars: 500 μm (left), 50 μm (right). (D) Survival rates and (E) size distribution in WT and mutants after starvation. Expression of (F) tp53 and (G) cdk1a show a dysregulation of cdkn1a in starved mutants. (H) Gene expression of lipid metabolism markers in starved WT fish. Statistical analysis was performed using the ANOVA and t test. *P < 0.05, **P < 0.001, ***P < 0.0001.

Expression Data
Genes:
Fish:
Condition:
Anatomical Term:
Stage: Days 14-20

Expression Detail
Antibody Labeling
Phenotype Data
Fish:
Condition:
Observed In:
Stage Range: Days 14-20 to Days 21-29

Phenotype Detail
Acknowledgments
This image is the copyrighted work of the attributed author or publisher, and ZFIN has permission only to display this image to its users. Additional permissions should be obtained from the applicable author or publisher of the image. Full text @ JCI Insight