FIGURE SUMMARY
Title

Zebrafish IL-4-like Cytokines and IL-10 Suppress Inflammation but Only IL-10 Is Essential for Gill Homeostasis

Authors
Bottiglione, F., Dee, C.T., Lea, R., Zeef, L.A.H., Badrock, A.P., Wane, M., Bugeon, L., Dallman, M.J., Allen, J.E., Hurlstone, A.F.L.
Source
Full text @ J. Immunol.

ZFIN is incorporating published figure images and captions as part of an ongoing project. Figures from some publications have not yet been curated, or are not available for display because of copyright restrictions.

Increased levels of proinflammatory cytokines in il4/13a;b−/− larvae. (A and B) qPCR analysis showing levels of il1β, il6, tnfα, ifng1–2, and mpx mRNA in wildtype, il4/13a−/−, il4/13b−/−, and il4/13a;b−/− 5 dpf larvae. Dots indicate individual fish. Gene expression was normalized to the expression of β−actin. Error bars represent SEM; n > 3, *p < 0.05, **p < 0.01, ***p < 0.001. (C) Representative image of mpx in situ hybridization in wildtype and il4/13a−/− 3 dpf larvae (n = 9–10). Purple dots indicate mpx+ cells. Scale bar, 100 μm. (D) Quantification of mpx+ cells in wildtype and il4/13a−/− larvae head region. Dots indicate individual fish.

ZFIN is incorporating published figure images and captions as part of an ongoing project. Figures from some publications have not yet been curated, or are not available for display because of copyright restrictions.

Mutation of il10 induces morphological changes in the gills of adult zebrafish. (A) Representative images of sections (n = 3) of gills from wildtype, il4/13a−/−, il4/13b−/−, il4/13a;b−/−, and il10e46/e46 animals stained with H&E. Gill arch (A), filaments (F), and lamellae (L) are indicated. Lamellar epithelial cell alteration (asterisks), filament thickening (triangle), and arch thickening (arrow) are indicated. (B) Quantification of gill tissue damage in wildtype, il4/13a−/−, il4/13b−/−, il4/13a;b−/−, and il10e46/e46. Widespread alteration is observed in the gills of il10e46/e46 animals. (C) Bar graph showing significantly enriched ontologies in gills of il10e46/e46 animals. (D) Heatmap of NES for indicated gene sets generated by GSEA in gills of il10e46/e46 compared with wildtype animals. (E) qPCR analysis showing transcript levels of il1β, il6, tnfα, and ifng1–2 in gills of il10e46/e46 compared with wildtype animals. Gene expression was normalized to the expression of β−actin. Error bars represent SEM; n > 3, *p < 0.05.

ZFIN is incorporating published figure images and captions as part of an ongoing project. Figures from some publications have not yet been curated, or are not available for display because of copyright restrictions.

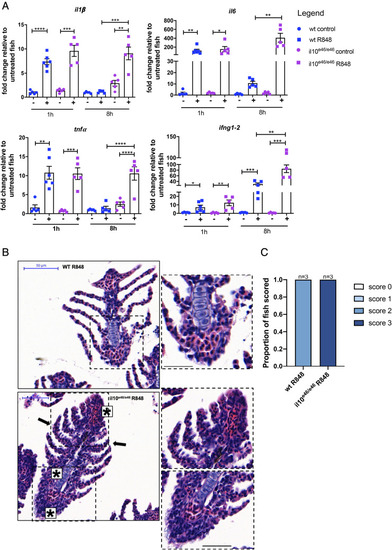
Prolonged inflammatory response in il10e46/e46 gills following R848 stimulation. (A) qPCR analysis showing transcript levels of il1β, il6, tnfα, and ifng1–2 in gills from wildtype and il10e46/e46 animals following R848 challenge for 1 and 8 h. Gene expression was normalized to the expression of β−actin. Fold change is shown. Error bars represent SEM; n > 3, *p < 0.05, **p < 0.01, ***p < 0.001, ****p < 0.0001. (B) Representative images of sections (n = 3) of gills from wildtype and il10e46/e46 animals (n = 3) stained with H&E following 8-h R848 challenge. Epithelial cell alteration in the lamellae (black arrows) and gill filament (stars) are indicated in gills from il10e46/e46 animals. Scale bar, 50 μm. (C) Quantification of gill tissue damage in wildtype and il10e46/e46 animals following R848 challenge.

Acknowledgments
This image is the copyrighted work of the attributed author or publisher, and ZFIN has permission only to display this image to its users. Additional permissions should be obtained from the applicable author or publisher of the image. Full text @ J. Immunol.