
- Title
-
Antiviral activity of palmitic acid via autophagic flux inhibition in zebrafish (Danio rerio)
- Authors
- Librán-Pérez, M., Pereiro, P., Figueras, A., Novoa, B.
- Source
- Full text @ Fish Shellfish Immunol.

ZFIN is incorporating published figure images and captions as part of an ongoing project. Figures from some publications have not yet been curated, or are not available for display because of copyright restrictions. PHENOTYPE:
|

Measurement of different immune parameters after PA treatment. (A) Effect of PA and SVCV infection in the apoptosis of ZF4 cells measured by flow cytometry. Data represent the mean of four independent experiments ± SEM. (B, C) Relative mRNA abundance of ifnphi1 (B) and ifnphi2(C) in pools of 4–5 zebrafish larvae treated or not with PA in the absence or presence of SVCV infection. The data represent the mean ± SEM of 5–6 measurements. (D, E) Neutrophil count in the transgenic Mpo:GFP zebrafish larvae treated with PA for 24 h and then infected or not with SVCV. The numbers in the images represent the animals with the shown phenotype per total analysed larvae. The neutrophil count is presented as the mean ± SEM of the analysed fish by treatment. Comparisons among groups were made using one-way ANOVA (multiple comparisons) followed by a Student-Newman-Keuls test. Significant differences are displayed as *** (0.0001 < p < 0.001), ** (0.001 < p < 0.01) or * (0.01 < p < 0.05). |

Palmitic acid activates autophagy in zebrafish larvae. Zebrafish GFP-Lc3 transgenic embryos were treated with PA by bath immersion, and 24 h later, they were infected with SVCV for 24 h. The intensity of the GFP-Lc3 signal was measured in the body muscle mass (A) and liver (B). Numbers in the images represent the animals with the shown phenotype per the total number of animals analysed (C). The results are presented as the mean ± SEM of the analysed fish by treatment. Comparisons among groups were made using one-way ANOVA (multiple comparisons) followed by a Student-Newman-Keuls test. Significant differences are displayed as *** (0.0001 < p < 0.001), ** (0.001 < p < 0.01) or * (0.01 < p < 0.05). |

Palmitic acid increases the Lc3b signal in ZF4 cells. (A) The ZF4 cells were incubated with PA for 24 h and subsequently infected or not with SVCV. At 24 hpi, the cells were fixed and immuno-stained for Lc3b (green) and actin (red) detection. Nuclei were stained with DAPI (blue). Images were taken by confocal microscopy to determine the proportion of Lc3-positive cells. (B) The percentage of Lc3-positive ZF4 cells after different treatments. Data are presented as the mean ± SEM of four independent experiments. (C, D) Western blot analysis of the Lc3 in ZF4 cells after PA treatment and/or SVCV infection. Graphs represent the Lc3-II/Lc3-I ratio. The actin bands were detected using an anti-actin antibody as an internal control for protein load. Data are shown as the mean ± SEM of 4 independent experiments. (E) Detection of the SVCV N gene in ZF4 cells incubated with PA, RAPA or PA + RAPA for 24 h and then infected with SVCV. The graph represents the means ± SEM of 5 independent biological replicates. Comparisons among groups were made using Student's t-test (paired comparisons) or one-way ANOVA (multiple comparisons) followed by a Student-Newman-Keuls test, and the differences were considered statistically significant at p < 0.05. Significant differences are displayed as *** (0.0001 < p < 0.001), ** (0.001 < p < 0.01) or * (0.01 < p < 0.05). (For interpretation of the references to colour in this figure legend, the reader is referred to the Web version of this article.) |
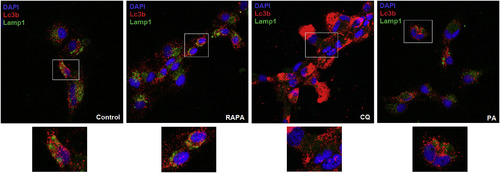
Palmitic acid inhibits autophagosome-lysosome fusion. The ZF4 cells under conditions of starvation were incubated with PA, RAPA or CQ for 2.5 h. Untreated controls were also included. After the incubation period, the cells were fixed and immuno-stained for Lc3b (red) and Lamp1 (green) detection. Nuclei were stained with DAPI (blue). Images were taken by confocal microscopy to determine the prevalence of the co-localization of Lc3b and Lamp1. Representative images were selected to reflect the effect of the different compounds on the autophagic flux. Yellow/orange puncta indicate co-localization of Lc3b and Lamp1 (autophagic flux). (For interpretation of the references to colour in this figure legend, the reader is referred to the Web version of this article.) |
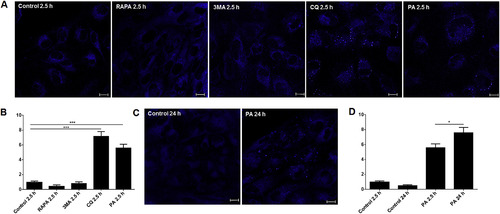
Palmitic acid does not affect lysosome acidity and integrity but increases the number of lysosomes per cell. The ZF4 cells were incubated for 2.5 h with PA, 3 MA, RAPA or CQ. Untreated controls were also included. For PA and untreated control, the ZF4 cells were also incubated for 24 h. Live cells were stained with LysoSensor Blue DND-167 reagent for acidic lysosomal vesicle detection. Images were taken by confocal microscopy. (A, B) Compared to the respective controls, RAPA- and 3 MA-treated cells showed no significant differences in the number of lysosomes after 2.5 h. CQ and PA induced a significant increase in the number of lysosomes per cell compared to the other treatments. (C, D) The accumulation of lysosomes induced by PA persisted after 24 h and was significantly higher compared to the cells stimulated for 2.5 h. Data are shown as the mean ± SEM of the number of lysosomes per cell counted in 8–10 images per treatment. Comparisons among groups were made using one-way ANOVA (multiple comparisons) followed by a Student-Newman-Keuls test. Significant differences are displayed as *** (0.0001 < p < 0.001), ** (0.001 < p < 0.01) or * (0.01 < p < 0.05). (For interpretation of the references to colour in this figure legend, the reader is referred to the Web version of this article.) |