
|
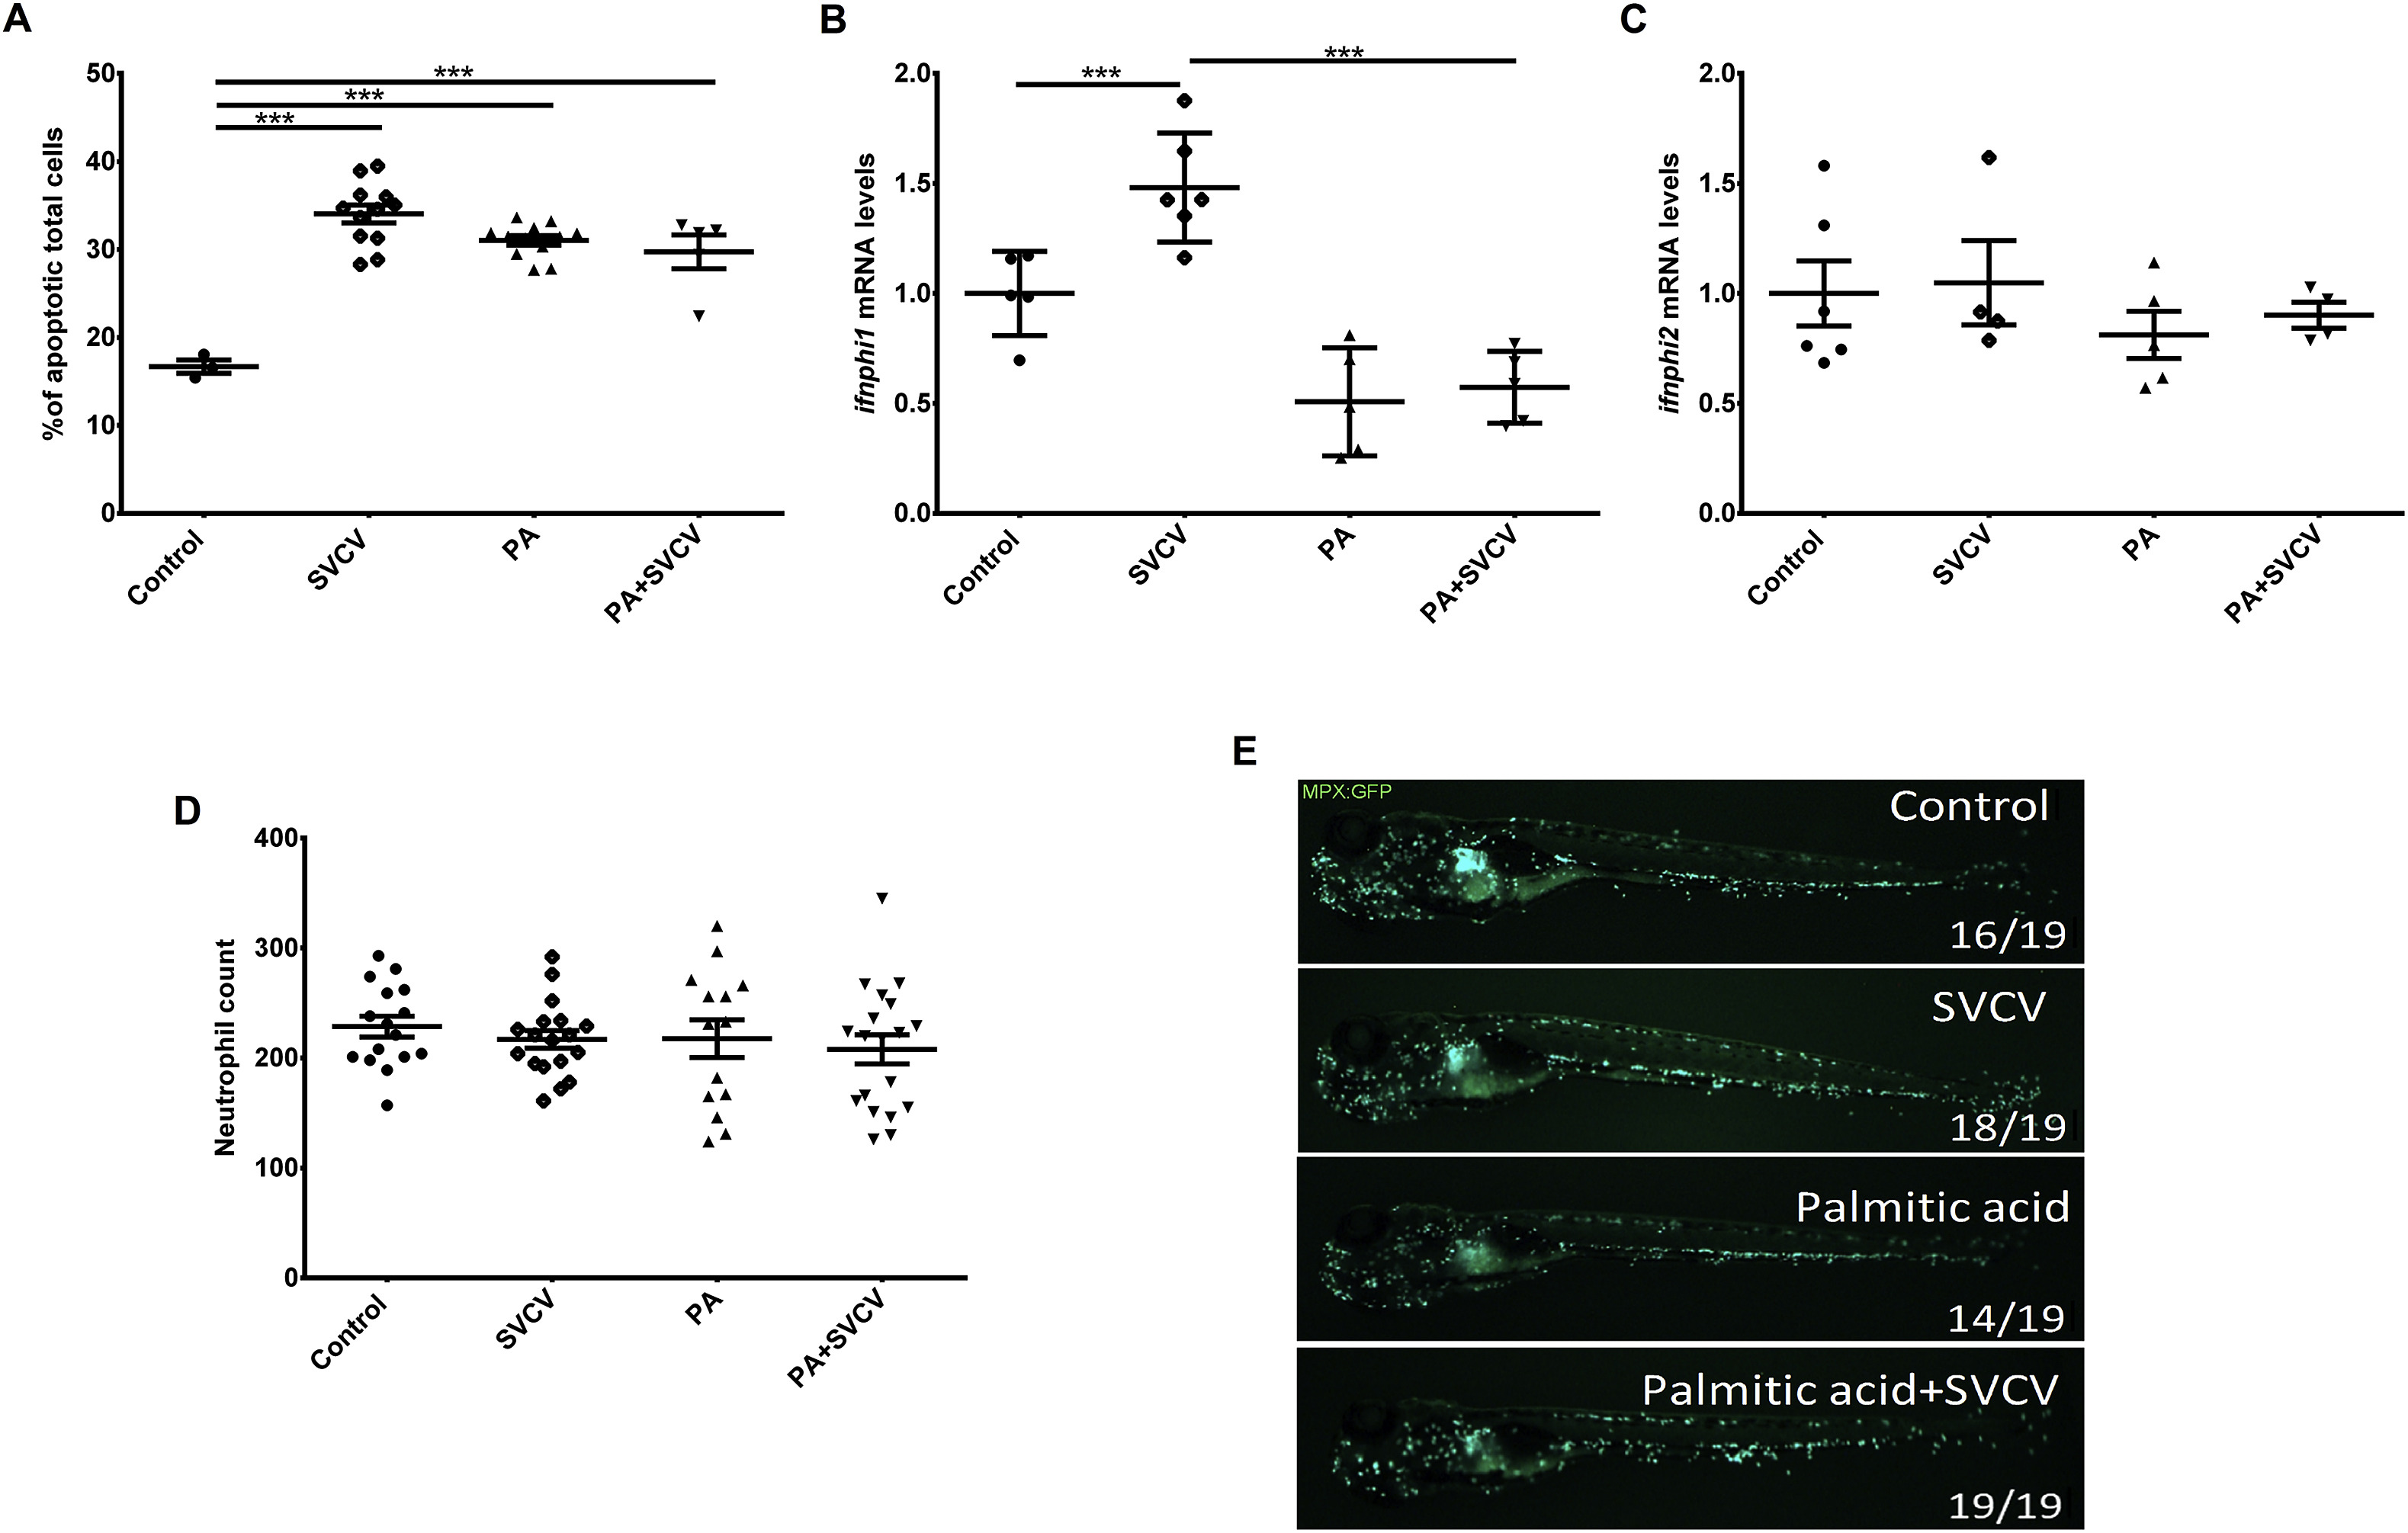
Fig. 2
Measurement of different immune parameters after PA treatment. (A) Effect of PA and SVCV infection in the apoptosis of ZF4 cells measured by flow cytometry. Data represent the mean of four independent experiments ± SEM. (B, C) Relative mRNA abundance of ifnphi1 (B) and ifnphi2(C) in pools of 4–5 zebrafish larvae treated or not with PA in the absence or presence of SVCV infection. The data represent the mean ± SEM of 5–6 measurements. (D, E) Neutrophil count in the transgenic Mpo:GFP zebrafish larvae treated with PA for 24 h and then infected or not with SVCV. The numbers in the images represent the animals with the shown phenotype per total analysed larvae. The neutrophil count is presented as the mean ± SEM of the analysed fish by treatment. Comparisons among groups were made using one-way ANOVA (multiple comparisons) followed by a Student-Newman-Keuls test. Significant differences are displayed as *** (0.0001 < p < 0.001), ** (0.001 < p < 0.01) or * (0.01 < p < 0.05).