
- Title
-
The Reprimo gene family member, reprimo-like (rprml), is required for blood development in embryonic zebrafish
- Authors
- Stanic, K., Reig, G., Wichmann, I.A., Opazo, J.C., Owen, G.I., Corvalán, A.H., Concha, M.L., Amigo, J.D.
- Source
- Full text @ Sci. Rep.

Bright-field microscopy shows no macroscopic anomalies in rprmlmorphants/mutants. (A-C) Lateral view of live embryos by bright field microscopy at 48hpf. (A) wild type, (B) CRISPR-Cas9-rprml and (C) rprml MO-injected embryos reveals grossly normal morphology. (Bottom panel) Normal vascular development in the brain vessels of wild type and rprml morphant embryos |
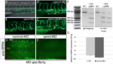
Similar phenotypes are obtained by disruption of rprml, either by CRISPR-Cas9 mutation or injection of antisense MOs. (A-E) lateral views of (A-C) live transgenic Tg(fli1:GFP) or (D-E) anti-RPRM IHC stained embryos at 48 hpf visualized by fluorescence and confocal microscopy, respectively. (A-A’) Normal vascular morphology is observed in control-MO-injected embryos. (B-C) Embryos injected with MOs or CRISPR-Cas9 targeting rprml exhibit reduced caudal hematopoietic tissue (CHT) territory (yellow double arrows). The yellow line represents the dorsal aorta (DA). (D-E) Rprm/Rprml protein expression is effectively blocked by rprml-MO. A human anti-RPRM/RPRML antibody labeled the Rohon-Beard neurons (RB, white arrows), the inter-somitic spaces (ISS, yellow arrows) and the pronephric tubule (pn, red brackets). A drastic reduction in immunoreactivity is observed in rprml MO-injected embryos compared to control MO-injected embryos. (F) Left panel: rprml CRISPR-Cas9 embryo genotyped by T7 endonuclease assay shows INDEL mutations of the expected sizes (500bp, 350bp). Right panel: in vitro DNA cleavage activity assay showing cropped areas containing Cas9-cleaved DNA bands of the expected sizes for rprml. A 1 kb DNA ladder was used as a molecular weight marker. (G) qPCR showing p53 relative expression in wild type and rprml MO specimens. Data shown as ΔCq ± SEM, (CI 95% = -8.41 ± 0.135 for wild type controls; CI 95% = -9.36 ± 0,65 for rprml morphants). |

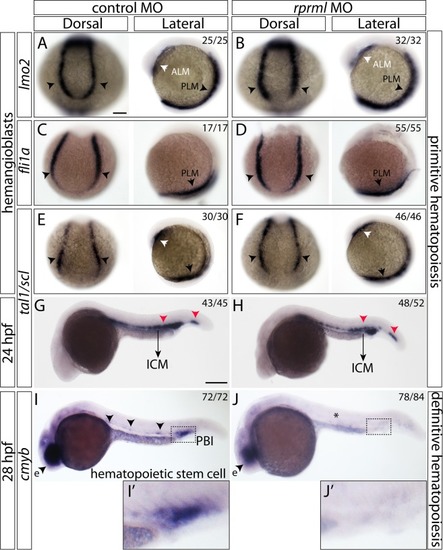
Early vascular development in rprml morphants. (A-D) Lateral view of embryonic zebrafish at 22 and 26 hpf analyzed by WISH for lmo2 (A-B) and fli1a (C-D). (A’- D’) Magnification of the trunk vessels. |
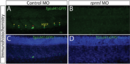
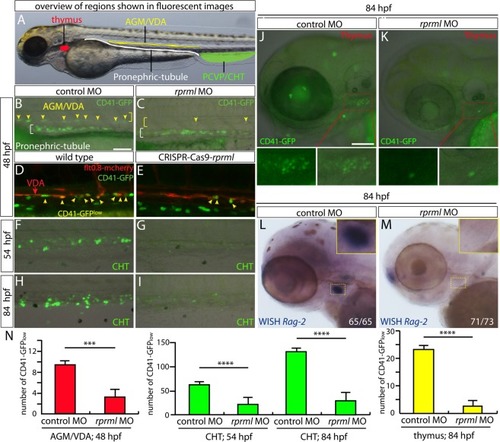
CD41 expression is reduced in the CHT of rprml morphants. (A-D) Lateral view of the trunk with anterior to the left. (A-B) Whole mount immunohistochemistry/immunofluorescence showing Tg(CD41:GFP) expression pattern at 54 hpf. Staining with anti-GFP indicates expression of HSPC (yellow arrows) in the CHT (green bracket). (C-D) topro-3 staining (blue) shows the localization of the nuclei. |

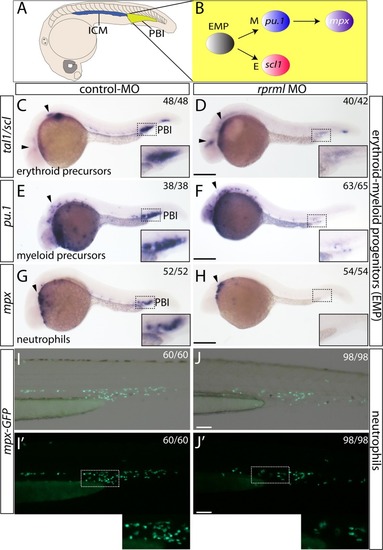
rprml deficiency by MOs results in reduce mpx+- and CD41+- cells during hematopoiesis. Fluorescent microscopy images for: (A-C) mpx+- and (D-F) CD41+ cell populations in transgenics Tg(mpx:GFP) and Tg(CD41:GFP) respectively . (B, E) rprml-MO injections cause reduction in mpx+- and CD41+ blood cells. (C, F) Co-injection rprml-MO and rprml mRNA significantly rescued the rprml morphant phenotype. (Bottom panels) Statistical significance was determined using two-tailed unpaired Student’s t-test. *** P ≤ 0.001, **** P ≤ 0.0001. |

lack of rprml hinders normal activation of the Notch signaling pathway. (AD) Lateral views of 24 hpf analyzed by WISH for (A-B) arterial endothelial cells (kdr1) and (C-D) vascular arterial progenitor cells (dll4). (E-L) Fluorescent microscopy images of transgenics: (E-F) Tg(dll4:GFP), (G-I) Tg(flt0.8:RFP) and (J-L) Tg(Tp1:nRFP). Brackets indicated the positioning of the dorsal aorta (DA). (K-L) Asterisks indicated reduced Notch activity in CRISPR-Cas9-rprml and/or rprml-MO injected embryos (DA). The number of embryos with the phenotype shown as a fraction of the total number of embryos examined is indicated in the top right corner in J-L. |

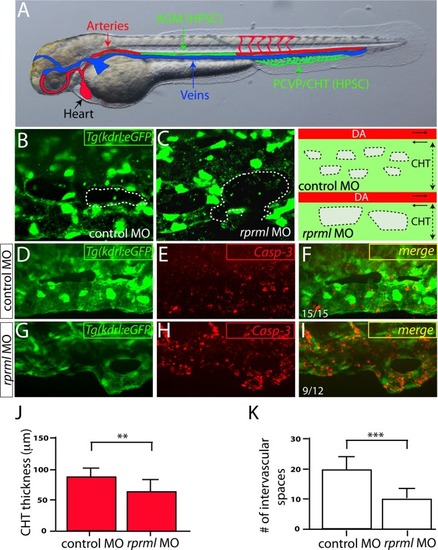
Knockdown of rprml impairs normal CHT niche morphogenesis. (A-B) Lateral view of double transgenic Tg(flk:mcherry;fli1:eGFP) embryos microinjected at 1-2 cell-stages with (A) control and (B) rprml morpholinos (MOs). The visualization at 48 hpf was done by live longitudinal confocal microscopy. Double arrows show the girth of the caudal hematopoietic tissue (CHT). Asterisks represent intervascular spaces. The number of embryos with the phenotype is shown as a fraction of the total number of examined embryos, indicated in the top right corner in A-B. Scale bars 50 µm. |
|
|
|
Lack of |