
- Title
-
Chronology-based architecture of descending circuits that underlie the development of locomotor repertoire after birth
- Authors
- Pujala, A., Koyama, M.
- Source
- Full text @ Elife
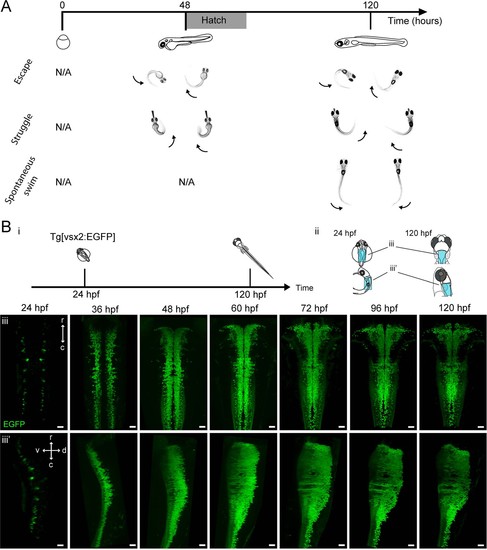
Development of zebrafish locomotor behaviors and genesis of hindbrain V2a neurons.(A) Development of locomotor behaviors in zebrafish. By the time of birth (48–72 hpf), in response to strong stimuli, zebrafish are capable of generating escapes and struggles that are characterized by strong whole body bends. During these behaviors fish can assume a C-shaped body posture as a result of simultaneous activation of ipsilateral axial muscles spanning most body segments (arrows). By 120 hpf, a fish also spontaneously exhibits weaker swimming (Spontaneous swim), which is characterized by bending of mostly the caudal portion of the tail by a relatively small amount. This indicates that the axial muscles in the caudal part of the tail are activated relatively weakly. (B) Emergence of hindbrain V2a neurons expressing EGFP. (i) Timing of experiments. (ii) Regions displayed (cyan patch) in subsequent panels. (iii) Dorsal and side views of hindbrain V2a neurons from 24 hpf to 120 hpf. The caudal end of the volume roughly corresponds to the boundary between hindbrain and spinal cord. r, rostral; c, caudal; d, dorsal; v, ventral. Scale bars, 30 μm. |
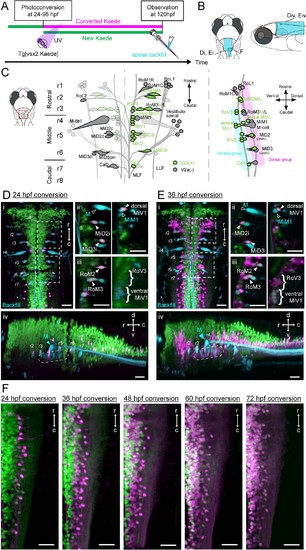
Birthdating and identification of hindbrain V2a descending neurons.(A) Experimental procedure. (B) Regions displayed (cyan patch). (C) A schema showing reticulospinal (RS) neurons and its V2a subpopulation in dorsal (left) and lateral (right) views based on Mendelson (1986) and Kimura et al. (2013). V2a neurons are indicated in green. Rostral, middle and caudal populations are in rhombomere 1–3 (r1, r2 and r3), 4–6 (r4, r5 and r6) and 7–8 (r7 and r8) respectively. Dorsal and ventral RS group are indicated in purple and cyan rectangles, respectively. (D) Hindbrain V2a neurons photoconverted at 24 hpf with spinal backfill of reticulospinal neurons. Green, unconverted Kaede; magenta, photoconverted Kaede; cyan, backfill; M, Mauthner. (i) Dorsal view. Dotted rectangles indicate the locations of panels ii and iii. (ii) Optical slices showing caudal reticulospinal neurons. (iii) Optical slices showing rostral reticulospinal neurons (left panel, dorsal slice; right panel, ventral slice). Filled arrowheads and curly brackets indicate V2a reticulospinal neurons. Open arrowheads indicate non-V2a reticulospinal neurons. (iv) Side-view. Dotted rounded rectangle indicates the location of ventral reticulospinal neurons. (E) Hindbrain V2a neurons photoconverted at 36 hpf, and reticulospinal neurons labeled with spinal backfill. Panels are organized as in C. (i) Dorsal view. (ii) Optical slices showing caudal reticulospinal neurons. (iii) Optical slices showing rostral reticulospinal neurons (left panel, dorsal slice; right panel, ventral slice). (iv) Side-view. Dotted rounded rectangle indicates the location of ventral reticulospinal neurons. (F) Dorsal views of caudal hindbrain V2a neurons photoconverted at 24, 36, 48, 60, and 72 hpf. r, rostral; c, caudal; d, dorsal; v, ventral. Scale bars, 30 μm |
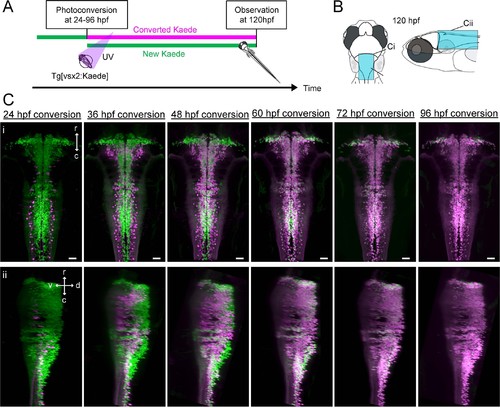
Birthdating of hindbrain V2a neurons.(A) Experimental procedure. (B) Regions displayed (cyan patch). (C) Dorsal (i) and side (ii) views of hindbrain V2a neurons at 120 hpf showing Kaede photoconverted at a specific time point (24 hpf – 96 hpf). Magenta, converted Kaede; green, unconverted Kaede; r, rostral; c, caudal; d, dorsal; v, ventral; Scale bars, 30 μm |
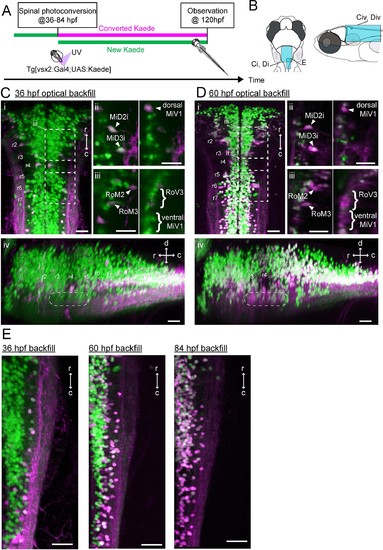
Development of spinal projections of hindbrain V2a descending neurons.(A) Experimental procedure. (B) Regions displayed. (C) Hindbrain V2a neurons optically backfilled from the rostral spinal cord at 36 hpf. Magenta, photoconverted Kaede; green, unconverted Kaede. (i) Dorsal view. Dotted rectangles indicate the locations of panels ii and iii. (ii) Optical slices showing caudal V2a reticulospinal neurons. (iii) Optical slices showing rostral V2a reticulospinal neurons (left panel, dorsal slice; right panel, ventral slice). (iv) Side-view. Dotted rounded rectangle indicates the position of ventral reticulospinal neurons. Hindbrain segments (r2 to r7) were identified based on V2a reticulospinal neurons. (D) Hindbrain V2a neurons optically backfilled from rostral spinal cord at 60 hpf. Photoconverted Kaede is shown in magenta and unconverted Kaede in green. (i) Dorsal view. Dotted rectangles indicate the locations of panels ii and iii. (ii) Optical slices showing caudal reticulospinal neurons. (iii) Optical slices showing rostral reticulospinal neurons (left panel, dorsal slice; right panel, ventral slice). (iv) Side-view. Dotted rounded rectangle indicates the location of ventral reticulospinal neurons. (E) Dorsal views of caudal hindbrain V2a neurons optically backfilled at 36, 60 and 84 hpf. r, rostral; c, caudal; d, dorsal; v, ventral; Scale bars, 30 μm. |
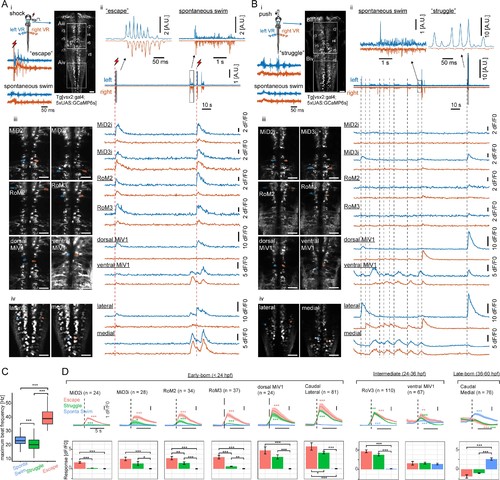
Recruitment of hindbrain V2a neurons during distinct locomotor behaviors.(A) Ca2+ responses of hindbrain V2a neurons during putative escape induced by a transient electrical stimulus to the head. (i) Experimental setup. The image on the right shows the dorsal view of hindbrain V2a neurons expressing GCaMP6s. White squares indicate the regions displayed in subsequent panels. Hindbrain segments (r2 to r8) were identified based on identifiable V2a reticulospinal neurons. Example raw traces from left and right ventral root (VR) activity during a putative escape and spontaneous swim episode (blue trace, left VR signal; orange trace, right VR signal; red thunder symbol, onset of an electrical pulse). (ii) Example traces of processed swim signals during a spontaneous weak swim episode and shock-induced strong swim episode. (blue trace, processed left VR; orange trace, processed right VR; red thunder mark, shock onset). (ii-iii) Location of hindbrain V2a neurons and corresponding Ca2+ traces during the locomotion patterns shown in panel i (blue, left ROIs and their Ca2+ responses; orange, right ROIs and their Ca2+ responses). Vertical dotted red lines indicate the onsets of the shock stimuli. (ii) Ca2+ traces of rostral V2a neurons (iii) Ca2+ traces of caudal hindbrain V2a neurons. (Scale bars in the images, 30 μm). (B) Ca2+ responses of hindbrain V2a neurons during a putative struggle induced by the gradual mechanical stimulus. The panels are organized as in A. Note the strong and slowly alternating (between left and right) axial motor activity in panel i. (C) Distribution of maximum tail beat frequency in each locomotor pattern (Spontaneous swims, 10,691 episodes; Struggle, 214 episodes; Escape, 183 episodes). Significant differences in maximum tail beat frequency across three locomotor patterns are indicated with asterisks (Dunn’s test, ***p<0.001). (D) Locomotion event-triggered average Ca2+ responses of hindbrain V2a neurons sorted based on their birthdate. Top, Time course of the event-triggered average Ca2+ response (Orange trace, putative escape; Green trace, putative struggle; Blue trace, spontaneous slow swim). Shaded area indicates standard error across replicates for each cell type (n, number of cells). Significant changes from the baselines are indicated with asterisks (paired t-test, *p<0.05, **p<0.01, ***p<0.001). Bottom, Peak amplitude of locomotion event-triggered average Ca2+ response (Orange bar, putative escape; Green bar, putative struggle; Blue bar, spontaneous slow swim). Significant differences in response amplitude across conditions are indicated with asterisks (Tukey test, *p<0.05, **p<0.01, ***p<0.001). |
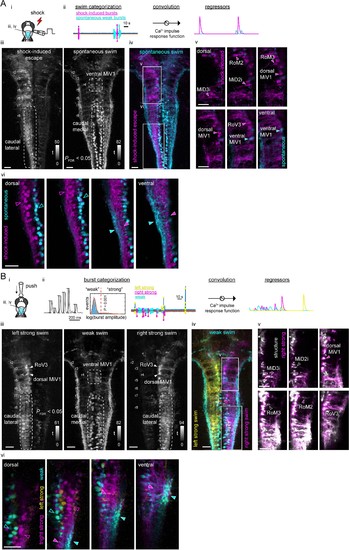
Functional segregation of the neuropil of hindbrain V2a neurons as revealed by regression analysis.(A) Regression analysis of hindbrain V2a neurons in the transient electrical stimulus (shock) experiment. (i) Experimental setup and the region displayed (cyan patch). (ii) Regressors used to create activity maps (see Materials and methods). (iii) Dorsal view of activity maps for each regressor. T-value was coded in grayscale and thresholded at PFDR (False Discovery Rate)<0.05 (see Materials and methods). Dotted round rectangles indicate distinct caudal hindbrain populations revealed by each regressor. (iv) Overlay of activity maps (cyan, spontaneous swim; magenta, shock-induced fast swim). Rectangles indicate the locations of the images in panel v and vi. (v) Optical slices of the overlaid activity maps in the rostral hindbrain (magenta, shock-induced swim; cyan, spontaneous swim). Arrowheads indicate reticulospinal neurons identified in each map. (vi) Optical slices of the overlaid activity maps in the caudal hindbrain (magenta, shock-induced swim; cyan, spontaneous swim). Arrowheads highlight the segregation of spontaneous swim related signal (cyan open arrowhead, cell bodies; cyan filled arrowhead, neuropil) and shock-induced swim related signal (magenta open arrowhead, cell bodies; magenta filled arrowhead, neuropil). Scale bars, 30 μm. (B) Regression analysis of hindbrain V2a neurons in the gradual mechanical stimulus (push) experiment. (i) Experimental setup and the region displayed (cyan patch). (ii) Regressors used to create activity maps (see Materials and methods). (iii) Dorsal view of activity maps for each regressor. T-value was coded in grayscale and thresholded at PFDR <0.05. Dotted round rectangles and arrowheads are used to highlight structures revealed in each activity map. (iv) Overlay of activity maps (cyan, weak swim; yellow, left strong swim; magenta, right strong swim). Rectangles indicate the locations of the images in panel v and vi. (v) Optical slices of the activity map for the right strong swim (magenta) overlaid on the structural image of V2a neurons (white) in the rostral hindbrain (magenta arrowheads, recruited reticulospinal neurons; white open arrowheads, non-recruited reticulospinal neurons). (vi) Optical slices of the overlaid activity maps in the caudal hindbrain (magenta, right strong swim; cyan, weak swim). Arrowheads highlight the segregation of weak swim-related signal (cyan open arrowhead, cell bodies; cyan filled arrowhead, neuropil) and strong swim-related signal (magenta open arrowhead, cell bodies; magenta filled arrowhead, neuropil). Scale bars, 30 μm. |
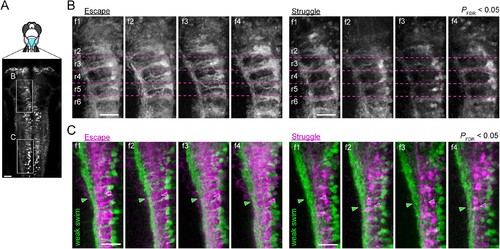
Activity maps from multiple subjects in the rostral and the caudal hindbrain.(A) Regions displayed (cyan patch). (B) Activity maps in the rostral hindbrain from multiple fish (f1 to f4). Dotted magenta lines indicate the boundaries between hindbrain segments (rhombomere 2 (r2) to rhombomere 6 (r6)). More V2a neurons are recruited consistently for putative escape. (C) Activity maps in the caudal hindbrain from multiple subjects (f1 to f4). Arrowheads highlight the functional segregation of neuropil. Scale bars, 30 μm. |
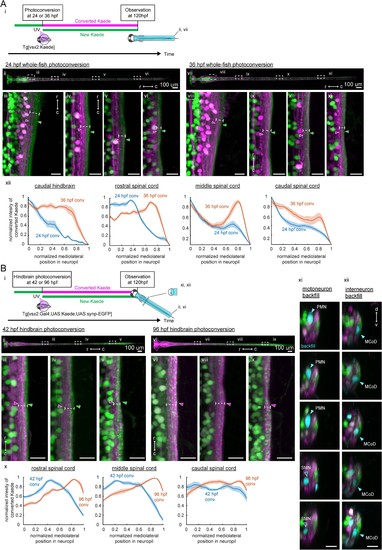
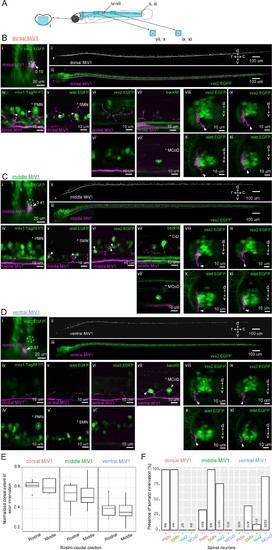
Birthdate-related segregation of spinal projections from hindbrain V2a neurons.(A) Birthdate-related segregation of the neuropil of V2a neurons in the hindbrain and the spinal cord. (i) Experimental procedure and region displayed (gray patch). Converted Kaede is shown in magenta and unconverted Kaede is shown in green. (ii-vi) Segregation of neuropil from V2a neurons born before and after 24 hpf. (ii) Dorsal view of the hindbrain and the spinal cord. Dotted rectangles indicate the locations of the images in the following panels. (iii-vi) Close-up views of the early-born neuropil (magenta arrowheads) and the late-born neuropil (green arrowheads) in the hindbrain and spinal cord. Dotted lines indicate the mediolateral extent of neuropil. (iii) Dorsal view of the caudal hindbrain. (iv) Dorsal view of the rostral spinal cord. (v) Dorsal view of the middle spinal cord. (vi) Dorsal view of the caudal spinal cord. r, rostral; c, caudal. Scale bars, 15 um. (vii-xi) Neuropil segregation between V2a neurons born before and after 36 hpf. Panels are organized as in ii-vi. (xii) Intensity profile of photoconverted Kaede in the neuropil. Normalized intensity of photoconverted Kaede is plotted as a function of normalized mediolateral position (dashed white lines in iii-vi, viii-xi) in the neuropil. Lines indicate the average of intensity distributions across fish, while shaded areas around the line represent the standard error (n = 6). Blue, photoconversion at 24 hpf; orange, photoconversion at 36 hpf. (B) Segregation of descending projections from hindbrain V2a neurons. (i) Procedure of the experiments and location of the images in panel ii and vi. (magenta, photoconverted Kaede; green, unconverted Kaede). (ii-v) Hindbrain V2a neurons are photoconverted at 42 hpf to highlight the spinal projections of the early-born and intermediate-aged hindbrain V2a neurons. Magenta arrowheads indicate the neuropil region occupied by the early-born hindbrain V2a neurons. Green arrows indicate spinal neuropil regions that have fewer projections of the early-born hindbrain V2a neurons. Dotted lines indicate the mediolateral extent of neuropil. (ii) Dorsal view of hindbrain and spinal cord. Dotted rectangles indicate the location of the images in panel iii-v. (iii) Dorsal view of the rostral spinal cord. (iv) Dorsal view of the middle spinal cord. (v) Dorsal view of the caudal spinal cord. (vi-ix) Hindbrain V2a neurons are photoconverted at 96 hpf to highlight the spinal projections of all hindbrain V2a descending neurons. Magenta arrowheads indicate the spinal neuropil filled with the hindbrain V2a descending neurons. Dotted lines indicate the mediolateral extent of neuropil. Panels vi to ix are organized as in panels ii-v. (x) Intensity profile of photoconverted Kaede in the neuropil. Normalized intensity of photoconverted Kaede is plotted against normalized mediolateral position in the neuropil (dashed white lines in iii-v, vii-ix). Lines indicate the average of intensity distributions across fish, while shaded areas around the line represent the standard error (n = 8). Blue, hindbrain photoconversion at 42 hpf; orange, hindbrain photoconversion at 96 hpf. (xi) Coronal views of spinal motoneurons in the rostral spinal cord. One side of the spinal cord is shown. Backfilled motoneurons are shown in cyan. Closed cyan arrowheads indicate primary motoneurons (PMN). Open arrowheads indicate secondary motoneurons (SMN). (xii) Coronal views of spinal interneurons in the rostral spinal cord. One side of the spinal cord is shown. Backfilled interneurons are shown in cyan. Closed cyan arrowheads indicate the late-born spinal interneuron, multipolar commissural neuron (MCoD).r, rostral; c, caudal; d, dorsal; v, ventral. Scale bars, 15 μm. |

Birthdating and electrophysiological analysis of V2a reticulospinal neurons in rhombomere 4.(A) V2a reticulospinal (RS) neurons in rhombomere 4. (i) Coronal view of V2a reticulospinal neurons in the region of rhombomere four shown by the cyan patch (green, EGFP; magenta, backfill; d, dorsal; v, ventral). Mauthner cell (M) and MiV1 neurons are highlighted. White horizontal lines in the image indicate the optical slices shown in panel ii. (ii) Optical slices showing reticulospinal neurons at different depths indicated by white lines in i. Asterisks indicate backfilled V2a neurons. MiM1 and dorsal MiV1 are highlighted with arrowheads. Other more ventral MiV1s are highlighted with curly brackets. (B) Birthdate-related topographical organization of V2a RS neurons in rhombomere 4. (i) Experimental procedure (ii) Region displayed (cyan patch) (iii) Coronal views of V2a RS neurons in rhombomere 4 at five dpf showing Kaede photoconverted at a specific time point (25–37 hpf) in magenta in upper panels and gray in lower panels. Dotted circles indicate dorsal MiV1. (C) Whole-cell recordings of V2a reticulospinal neurons in rhombomere 4. Top orange row, an early-born dorsal V2a neuron (dorsal); Middle green row, an intermediate V2a neuron (middle); Bottom blue row, a late-born V2a neuron (ventral). (i) Coronal view of the patched cell (gray, white arrow). Green, unconverted Kaede. Magenta, converted Kaede. Dotted circles indicate dorsal MiV1. The number near the white arrowhead indicates normalized dorso-ventral position of the patched cell (see Materials and methods). (ii) Intracellular activity during shock-induced fast swimming (left) and spontaneous slow swimming (right). An arrowhead indicates the onset of the tail shock. VR, ventral root recording. Gray shaded boxes indicate similar fast beat frequencies. (iii) Number of spikes (left) and membrane depolarization (right) as a function of beat frequency. Open circles are raw data points. The solid line represents mean ± standard error from data binned at 10 Hz intervals. (D) Number of spikes per cycle during fast beat frequency (>35 Hz) and slow beat frequency (<35 Hz) for each age group (dorsal MiV1, n = 8; middle MiV1, n = 13; ventral MiV1, n = 23). Significant differences are indicated with asterisks (**p<0.01, ***p<0.001). (E) Membrane depolarization during fast swim (>35 Hz) and slow beat frequency (<35 Hz) for each age group (dorsal MiV1, n = 8; middle MiV1, n = 13; ventral MiV1, n = 23). Significant modulations based on beat frequency are indicated with asterisks (***p<0.001). (F) Intrinsic properties of each age group (dorsal MiV1, n = 8; middle MiV1, n = 13; ventral MiV1, n = 23). Rin, input resistance; Vrest, resting membrane potential; Tau, membrane time constant; Cm, membrane capacitance. Significant differences are indicated with asterisks (Dunn’s test, **p<0.01, ***p<0.001). |

Emergence and migration of hindbrain V2a neurons in rhombomere 4.(A) Emergence of V2a neurons in rhombomere 4. (i) Experimental procedure (ii) Region displayed (cyan patch) (iii) Time lapse coronal views of hindbrain V2a neurons in rhombomere 4 from 25 hpf to 37 hpf. Dotted circles indicate the locations of the earliest born neurons in rhombomere 4 (dorsal MiV1). d, dorsal; v, ventral. Scale bars, 30 μm. (B) Migration of V2a neurons in rhombomere 4. (i) Experimental procedure (ii) Region displayed (cyan patch). (iii) Time lapse coronal views of hindbrain V2a neurons expressing Kaede from 48 hpf to 78 hpf after photoconversion at 48 hpf. Asterisks indicate the locations of the earliest born neurons in rhombomere 4 (dorsal MiV1) tracked throughout the experiment. Dotted rectangles show the location of magnified images in insets. (inset) Dotted circle indicates dorsal MiV1. White arrowhead indicates the V2a neurons migrating ventrally past dorsal MiV1. d, dorsal; v, ventral. Scale bars, 30 μm. |
Spinal projections of V2a reticulospinal neurons in rhombomere 4.(A) Regions displayed (cyan patches) in B, C and D. (B) Spinal projection of an early-born V2a neuron (dorsal MiV1). (i) Coronal view of a dorsal MiV1 neuron (white arrowhead) electroporated with a dextran dye (magenta) in the background of V2a neurons (green). Dotted circles indicate dorsal MiV1. The number near the white arrowhead indicates normalized dorso-ventral position of the labeled cell (see Materials and methods). (ii) Side view of the spinal projection from dorsal MiV1. (iii) Same as in (ii) but overlaid on V2a neurons shown in green. (iv-vii) Sagittal optical slices showing the projection (iv) Projection relative to spinal mnx1+ neurons. Primary motoneurons (PMN) are indicated with asterisks. Processes juxtaposed to the cell body of PMN are highlighted with filled arrows. (v) Projection relative to spinal islet1+ neurons. Secondary motoneurons (SMN) are indicated with asterisks. Processes close to the cell body of SMN are highlighted with filled arrows. (vi-vi’) Projection relative to spinal V2a neurons. (vi) Optical slice showing the processes. (vi’) Optical slice medial to vi. (vii-vii’) Projection relative to a backfilled multipolar commissural descending neuron (MCoD). (vii) Optical slice showing the projection. (vii’) Optical slice lateral to vii showing the location of MCoD. (viii-xi) Coronal views of the projection of dorsal MiV1 in the rostral spinal cord (viii, x) and in the middle spinal cord (ix, xi) with V2a neurons labeled in EGFP (viii, ix) or with islet+ neurons labeled in EGFP (x, xi). (C) Spinal projection of an intermediate V2a neuron (middle MiV1). Images are organized similarly to B. (vii) Circumferential ipsilateral descending neuron (CiD) is indicated with asterisks. (D) Spinal projection of a late-born V2a neuron (ventral MiV1). Images are organized similarly to B. (iv-iv’) Projection relative to spinal mnx+ neurons. (iv) Optical slice showing the processes. (iv’) Optical slice medial to iv. (v–v’) Projection relative to spinal islet+ neurons. (v) Optical slice showing the processes. (v’) Optical slice medial to v. (vi-vi’) Projection relative to spinal V2a neurons. (vi) Optical slice showing the processes. (vi’) Optical slice medial to v. (vii) Projection relative to a backfilled MCoD. (vii-xi) Coronal views are organized as in B. (E) Dorsal extent of axon innervation of V2a reticulospinal neurons in rhombomere 4. The dorsal extent of axon innervation is normalized to the thickness of spinal cord in dorsoventral axis. The main effect of hindbrain cell type (dorsal, middle, and ventral MiV1) was significant (p<0.001). (F) Somatic innervations of rhombomere 4 V2a reticulospinal neurons to spinal cell types. Percentage of cells showing somatic innervation to specific spinal cell types (PMN, SMN, vsx2, MCoD) are shown. The number of neurons showing innervation to a given class and the number of neurons examined are indicated at the bottom of each bar. The main effect of hindbrain cell type (dorsal, middle and ventral) was significant (p<0.001). The interaction of hindbrain cell type and spinal cell type was also significant (p<0.001). |
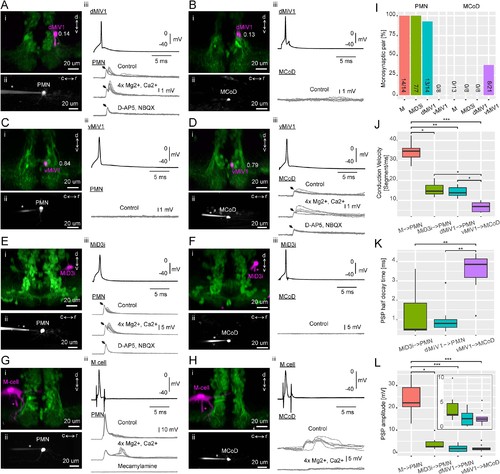
Synaptic connectivity of hindbrain V2a descending neurons.(A–H) Paired recordings of hindbrain neurons and spinal neurons. dMiV1, dorsal MiV1; vMiV1, ventral MiV1; M, Mauthner; PMN, primary motoneuron; MCoD, multipolar commissural neuron. (i) Coronal view of a patched hindbrain neuron (magenta) overlaid on V2a neurons (green). An asterisk indicates the patch pipette in use. The numbers in A-D indicate normalized dorsoventral position of patched MiV1 neurons. (ii) Side view of a patched spinal neuron (gray). (iii) Traces of postsynaptic potentials (PSPs) in a spinal neuron following spikes generated in a hindbrain neuron in control condition (top gray trace), in high divalent cation solution (middle gray trace) and following the blockade of chemical synapses (bottom gray trace). A black arrow highlights the putative electrical component of the postsynaptic potential. For simplicity, only one action potential trace is shown (top black trace). (I) Monosynaptic connections of hindbrain descending neurons to spinal neurons. Percentage of pairs showing monosynaptic connections to spinal neurons are shown. The number of connected pairs and the number of pairs examined are indicated at the bottom of each bar. The main effect of hindbrain cell types on the percentage of monosynaptic connection was significant (p<0.001). The main effect of spinal cell types was also significant (p<0.001). (J) Conduction velocity of monosynaptically connected pairs. Conduction velocity was defined as the number of muscle segments an action potential propagated in a millisecond. Box and whisker plots represent median (horizontal line across a box) as well as first and third quartiles. Asterisks mark significant differences between given connections (Dunn’s test, *p<0.05, **p<0.01, ***p<0.001). (K) Half decay time of monosynaptic PSPs. Data are presented as in J. (L) Amplitude of monosynaptic PSPs. Data are presented as J. (inset) Zoomed-in box and whisker plots for the pairs with smaller PSP. |
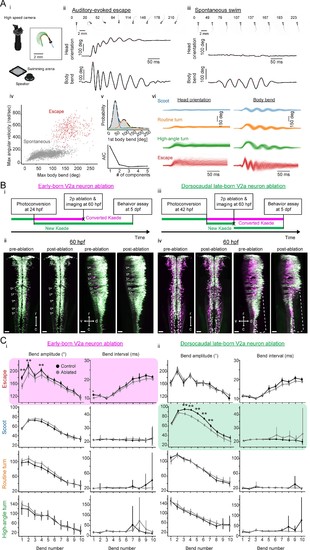
Contributions of hindbrain V2a neurons to evoked and spontaneous locomotion.(A) Examined locomotion patterns. (i) Experimental setup. (inset) Example fish image showing tracking of head orientation and tail curvature (see Materials and methods). Blue arrow, head orientation; Red dots, tracked midline points; Green arrows, tangent vectors along the midline points. (ii) Auditory-evoked escape response. (Top row) Images of fish during escape response. The number on each the images is time from the stimulus onset in milliseconds. (Middle row) Time course of head orientation. (Bottom row) Time course of total body bend (see Materials and methods). (iii) Spontaneous swimming. Panels are organized similarly to ii but the number on each image is time from the movement onset in milliseconds. (iv) Scatter plot of maximum bend amplitude (during a swim episode) and maximum angular velocity for auditory-evoked escapes (n = 426 episodes, N = 10 fish, red points) and spontaneous swims (n = 6088 episodes, N = 15 fish, gray points). (v) (Top) Probability of initial bend amplitude for 6056 spontaneous swim events. A fit of gaussian mixture model identified three components. (Bottom) The Akaike information criterion (AIC) as a function of number of components. Three components led to the lowest AIC value. (vi) Overlaid traces of head orientation and total body bend for three identified spontaneous swim categories (Scoot, 3969 episodes, blue; Routine turn, 1565 episodes, orange; High-angle turn, 376 episodes, green) and auditory-evoked escape (Escapes, 381 episodes, red). (B) Femtosecond laser ablation of hindbrain V2a neurons. (i) Experimental procedure for the ablation of early-born V2a neurons. (ii) Maximum intensity projections before and after ablation at 60 hpf (left, dorsal view; right, side view). White open arrowheads indicate the locations of the early-born V2a neurons.(iii) Experimental procedure for the ablation of dorsocaudal late-born V2a neurons. (iv) Maximum intensity projections before and after ablation at 60 hpf (left, dorsal view; right, side view). White rounded rectangles indicate the location of the late-born dorsocaudal V2a neurons. r, rostral; c, caudal; d, dorsal; v ventral; scale bars, 30 μm. (C) Effects of hindbrain V2a neuron ablations on the bend amplitudes and periods (or intervals) of the four distinct locomotion patterns. (i) Effects of the early-born V2a neuron ablation. Bend amplitude and interval are quantified bend-by-bend from 1st bend to 10th bend (see Materials and methods). Asterisks mark significant differences between ablated and control fish (**p<0.01, corrected for multiple comparisons, Holm test). Error bars, 99 percent confidence interval. The swim category that showed significant effects are highlighted in magenta. (ii) Effects of the late-born dorsocaudal V2a neuron ablation. Panels are organized as in i. The swim category that showed significant effects are highlighted in green. |

Confirmation of hindbrain V2a neuron ablations at four dpf.(A) Maximum intensity projections of hindbrain V2a neurons expressing Kaede from a fish in which early-born neurons were ablated (see Figure 11B i-ii) as well as from a control fish at four dpf (left, dorsal view; right, side view; magenta, photoconverted Kaede; green, unconverted Kaede). Contrast of magenta channel was enhanced to improve the visibility of early-born neurons, which made late-born neurons appear white. Open arrowheads indicate locations of early-born neurons (magenta). Note the lack of magenta cells in the ablated fish. Asterisks mark the bright structures in the red channel located outside the brain. r, rostral; c, caudal; d, dorsal; v ventral; scale bars, 30 μm. (B) Maximum intensity projections of hindbrain V2a neurons from a fish in which dorsocaudal late-born neurons were ablated (see Figure 11B iii-iv) as well as a control fish at four dpf (left, dorsal view; right, side view; magenta, photoconverted Kaede; green, unconverted Kaede). Rounded dotted rectangle in each image indicates the location of neurons that were targeted in the ablated fish. r, rostral; c, caudal; d, dorsal; v ventral; scale bars, 30 μm. |