
Fig. 5
- ID
- ZDB-FIG-190718-24
- Publication
- Pujala et al., 2019 - Chronology-based architecture of descending circuits that underlie the development of locomotor repertoire after birth
- Other Figures
- All Figure Page
- Back to All Figure Page
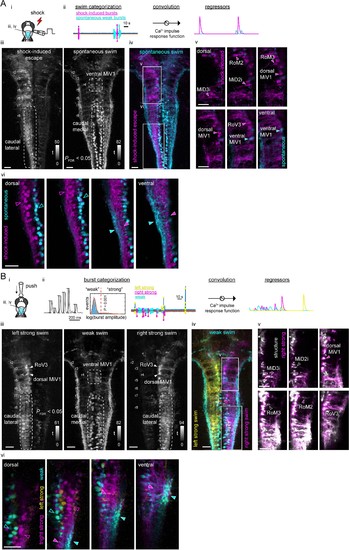
Functional segregation of the neuropil of hindbrain V2a neurons as revealed by regression analysis.(A) Regression analysis of hindbrain V2a neurons in the transient electrical stimulus (shock) experiment. (i) Experimental setup and the region displayed (cyan patch). (ii) Regressors used to create activity maps (see Materials and methods). (iii) Dorsal view of activity maps for each regressor. T-value was coded in grayscale and thresholded at PFDR (False Discovery Rate)<0.05 (see Materials and methods). Dotted round rectangles indicate distinct caudal hindbrain populations revealed by each regressor. (iv) Overlay of activity maps (cyan, spontaneous swim; magenta, shock-induced fast swim). Rectangles indicate the locations of the images in panel v and vi. (v) Optical slices of the overlaid activity maps in the rostral hindbrain (magenta, shock-induced swim; cyan, spontaneous swim). Arrowheads indicate reticulospinal neurons identified in each map. (vi) Optical slices of the overlaid activity maps in the caudal hindbrain (magenta, shock-induced swim; cyan, spontaneous swim). Arrowheads highlight the segregation of spontaneous swim related signal (cyan open arrowhead, cell bodies; cyan filled arrowhead, neuropil) and shock-induced swim related signal (magenta open arrowhead, cell bodies; magenta filled arrowhead, neuropil). Scale bars, 30 μm. (B) Regression analysis of hindbrain V2a neurons in the gradual mechanical stimulus (push) experiment. (i) Experimental setup and the region displayed (cyan patch). (ii) Regressors used to create activity maps (see Materials and methods). (iii) Dorsal view of activity maps for each regressor. T-value was coded in grayscale and thresholded at PFDR <0.05. Dotted round rectangles and arrowheads are used to highlight structures revealed in each activity map. (iv) Overlay of activity maps (cyan, weak swim; yellow, left strong swim; magenta, right strong swim). Rectangles indicate the locations of the images in panel v and vi. (v) Optical slices of the activity map for the right strong swim (magenta) overlaid on the structural image of V2a neurons (white) in the rostral hindbrain (magenta arrowheads, recruited reticulospinal neurons; white open arrowheads, non-recruited reticulospinal neurons). (vi) Optical slices of the overlaid activity maps in the caudal hindbrain (magenta, right strong swim; cyan, weak swim). Arrowheads highlight the segregation of weak swim-related signal (cyan open arrowhead, cell bodies; cyan filled arrowhead, neuropil) and strong swim-related signal (magenta open arrowhead, cell bodies; magenta filled arrowhead, neuropil). Scale bars, 30 μm. |