
Fig. 8
- ID
- ZDB-FIG-190718-29
- Publication
- Pujala et al., 2019 - Chronology-based architecture of descending circuits that underlie the development of locomotor repertoire after birth
- Other Figures
- All Figure Page
- Back to All Figure Page
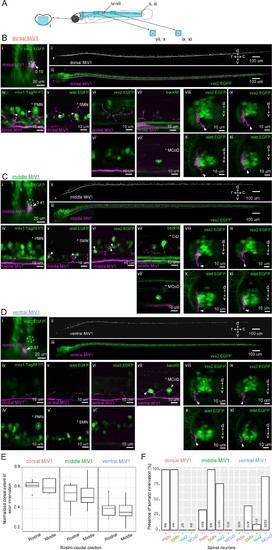
Spinal projections of V2a reticulospinal neurons in rhombomere 4.(A) Regions displayed (cyan patches) in B, C and D. (B) Spinal projection of an early-born V2a neuron (dorsal MiV1). (i) Coronal view of a dorsal MiV1 neuron (white arrowhead) electroporated with a dextran dye (magenta) in the background of V2a neurons (green). Dotted circles indicate dorsal MiV1. The number near the white arrowhead indicates normalized dorso-ventral position of the labeled cell (see Materials and methods). (ii) Side view of the spinal projection from dorsal MiV1. (iii) Same as in (ii) but overlaid on V2a neurons shown in green. (iv-vii) Sagittal optical slices showing the projection (iv) Projection relative to spinal mnx1+ neurons. Primary motoneurons (PMN) are indicated with asterisks. Processes juxtaposed to the cell body of PMN are highlighted with filled arrows. (v) Projection relative to spinal islet1+ neurons. Secondary motoneurons (SMN) are indicated with asterisks. Processes close to the cell body of SMN are highlighted with filled arrows. (vi-vi’) Projection relative to spinal V2a neurons. (vi) Optical slice showing the processes. (vi’) Optical slice medial to vi. (vii-vii’) Projection relative to a backfilled multipolar commissural descending neuron (MCoD). (vii) Optical slice showing the projection. (vii’) Optical slice lateral to vii showing the location of MCoD. (viii-xi) Coronal views of the projection of dorsal MiV1 in the rostral spinal cord (viii, x) and in the middle spinal cord (ix, xi) with V2a neurons labeled in EGFP (viii, ix) or with islet+ neurons labeled in EGFP (x, xi). (C) Spinal projection of an intermediate V2a neuron (middle MiV1). Images are organized similarly to B. (vii) Circumferential ipsilateral descending neuron (CiD) is indicated with asterisks. (D) Spinal projection of a late-born V2a neuron (ventral MiV1). Images are organized similarly to B. (iv-iv’) Projection relative to spinal mnx+ neurons. (iv) Optical slice showing the processes. (iv’) Optical slice medial to iv. (v–v’) Projection relative to spinal islet+ neurons. (v) Optical slice showing the processes. (v’) Optical slice medial to v. (vi-vi’) Projection relative to spinal V2a neurons. (vi) Optical slice showing the processes. (vi’) Optical slice medial to v. (vii) Projection relative to a backfilled MCoD. (vii-xi) Coronal views are organized as in B. (E) Dorsal extent of axon innervation of V2a reticulospinal neurons in rhombomere 4. The dorsal extent of axon innervation is normalized to the thickness of spinal cord in dorsoventral axis. The main effect of hindbrain cell type (dorsal, middle, and ventral MiV1) was significant (p<0.001). (F) Somatic innervations of rhombomere 4 V2a reticulospinal neurons to spinal cell types. Percentage of cells showing somatic innervation to specific spinal cell types (PMN, SMN, vsx2, MCoD) are shown. The number of neurons showing innervation to a given class and the number of neurons examined are indicated at the bottom of each bar. The main effect of hindbrain cell type (dorsal, middle and ventral) was significant (p<0.001). The interaction of hindbrain cell type and spinal cell type was also significant (p<0.001). |