
Fig. 2
- ID
- ZDB-FIG-190718-18
- Publication
- Pujala et al., 2019 - Chronology-based architecture of descending circuits that underlie the development of locomotor repertoire after birth
- Other Figures
- All Figure Page
- Back to All Figure Page
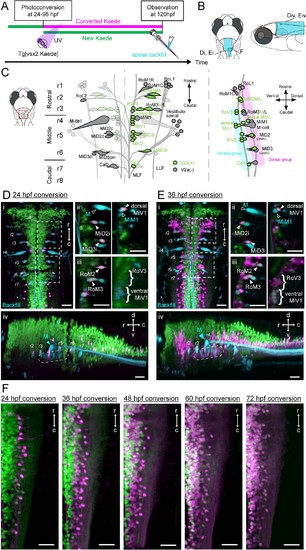
Birthdating and identification of hindbrain V2a descending neurons.(A) Experimental procedure. (B) Regions displayed (cyan patch). (C) A schema showing reticulospinal (RS) neurons and its V2a subpopulation in dorsal (left) and lateral (right) views based on Mendelson (1986) and Kimura et al. (2013). V2a neurons are indicated in green. Rostral, middle and caudal populations are in rhombomere 1–3 (r1, r2 and r3), 4–6 (r4, r5 and r6) and 7–8 (r7 and r8) respectively. Dorsal and ventral RS group are indicated in purple and cyan rectangles, respectively. (D) Hindbrain V2a neurons photoconverted at 24 hpf with spinal backfill of reticulospinal neurons. Green, unconverted Kaede; magenta, photoconverted Kaede; cyan, backfill; M, Mauthner. (i) Dorsal view. Dotted rectangles indicate the locations of panels ii and iii. (ii) Optical slices showing caudal reticulospinal neurons. (iii) Optical slices showing rostral reticulospinal neurons (left panel, dorsal slice; right panel, ventral slice). Filled arrowheads and curly brackets indicate V2a reticulospinal neurons. Open arrowheads indicate non-V2a reticulospinal neurons. (iv) Side-view. Dotted rounded rectangle indicates the location of ventral reticulospinal neurons. (E) Hindbrain V2a neurons photoconverted at 36 hpf, and reticulospinal neurons labeled with spinal backfill. Panels are organized as in C. (i) Dorsal view. (ii) Optical slices showing caudal reticulospinal neurons. (iii) Optical slices showing rostral reticulospinal neurons (left panel, dorsal slice; right panel, ventral slice). (iv) Side-view. Dotted rounded rectangle indicates the location of ventral reticulospinal neurons. (F) Dorsal views of caudal hindbrain V2a neurons photoconverted at 24, 36, 48, 60, and 72 hpf. r, rostral; c, caudal; d, dorsal; v, ventral. Scale bars, 30 μm |