
Fig. 10
- ID
- ZDB-FIG-190718-31
- Publication
- Pujala et al., 2019 - Chronology-based architecture of descending circuits that underlie the development of locomotor repertoire after birth
- Other Figures
- All Figure Page
- Back to All Figure Page
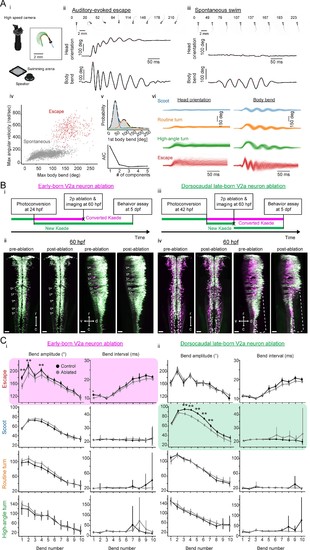
Contributions of hindbrain V2a neurons to evoked and spontaneous locomotion.(A) Examined locomotion patterns. (i) Experimental setup. (inset) Example fish image showing tracking of head orientation and tail curvature (see Materials and methods). Blue arrow, head orientation; Red dots, tracked midline points; Green arrows, tangent vectors along the midline points. (ii) Auditory-evoked escape response. (Top row) Images of fish during escape response. The number on each the images is time from the stimulus onset in milliseconds. (Middle row) Time course of head orientation. (Bottom row) Time course of total body bend (see Materials and methods). (iii) Spontaneous swimming. Panels are organized similarly to ii but the number on each image is time from the movement onset in milliseconds. (iv) Scatter plot of maximum bend amplitude (during a swim episode) and maximum angular velocity for auditory-evoked escapes (n = 426 episodes, N = 10 fish, red points) and spontaneous swims (n = 6088 episodes, N = 15 fish, gray points). (v) (Top) Probability of initial bend amplitude for 6056 spontaneous swim events. A fit of gaussian mixture model identified three components. (Bottom) The Akaike information criterion (AIC) as a function of number of components. Three components led to the lowest AIC value. (vi) Overlaid traces of head orientation and total body bend for three identified spontaneous swim categories (Scoot, 3969 episodes, blue; Routine turn, 1565 episodes, orange; High-angle turn, 376 episodes, green) and auditory-evoked escape (Escapes, 381 episodes, red). (B) Femtosecond laser ablation of hindbrain V2a neurons. (i) Experimental procedure for the ablation of early-born V2a neurons. (ii) Maximum intensity projections before and after ablation at 60 hpf (left, dorsal view; right, side view). White open arrowheads indicate the locations of the early-born V2a neurons.(iii) Experimental procedure for the ablation of dorsocaudal late-born V2a neurons. (iv) Maximum intensity projections before and after ablation at 60 hpf (left, dorsal view; right, side view). White rounded rectangles indicate the location of the late-born dorsocaudal V2a neurons. r, rostral; c, caudal; d, dorsal; v ventral; scale bars, 30 μm. (C) Effects of hindbrain V2a neuron ablations on the bend amplitudes and periods (or intervals) of the four distinct locomotion patterns. (i) Effects of the early-born V2a neuron ablation. Bend amplitude and interval are quantified bend-by-bend from 1st bend to 10th bend (see Materials and methods). Asterisks mark significant differences between ablated and control fish (**p<0.01, corrected for multiple comparisons, Holm test). Error bars, 99 percent confidence interval. The swim category that showed significant effects are highlighted in magenta. (ii) Effects of the late-born dorsocaudal V2a neuron ablation. Panels are organized as in i. The swim category that showed significant effects are highlighted in green. |