
|
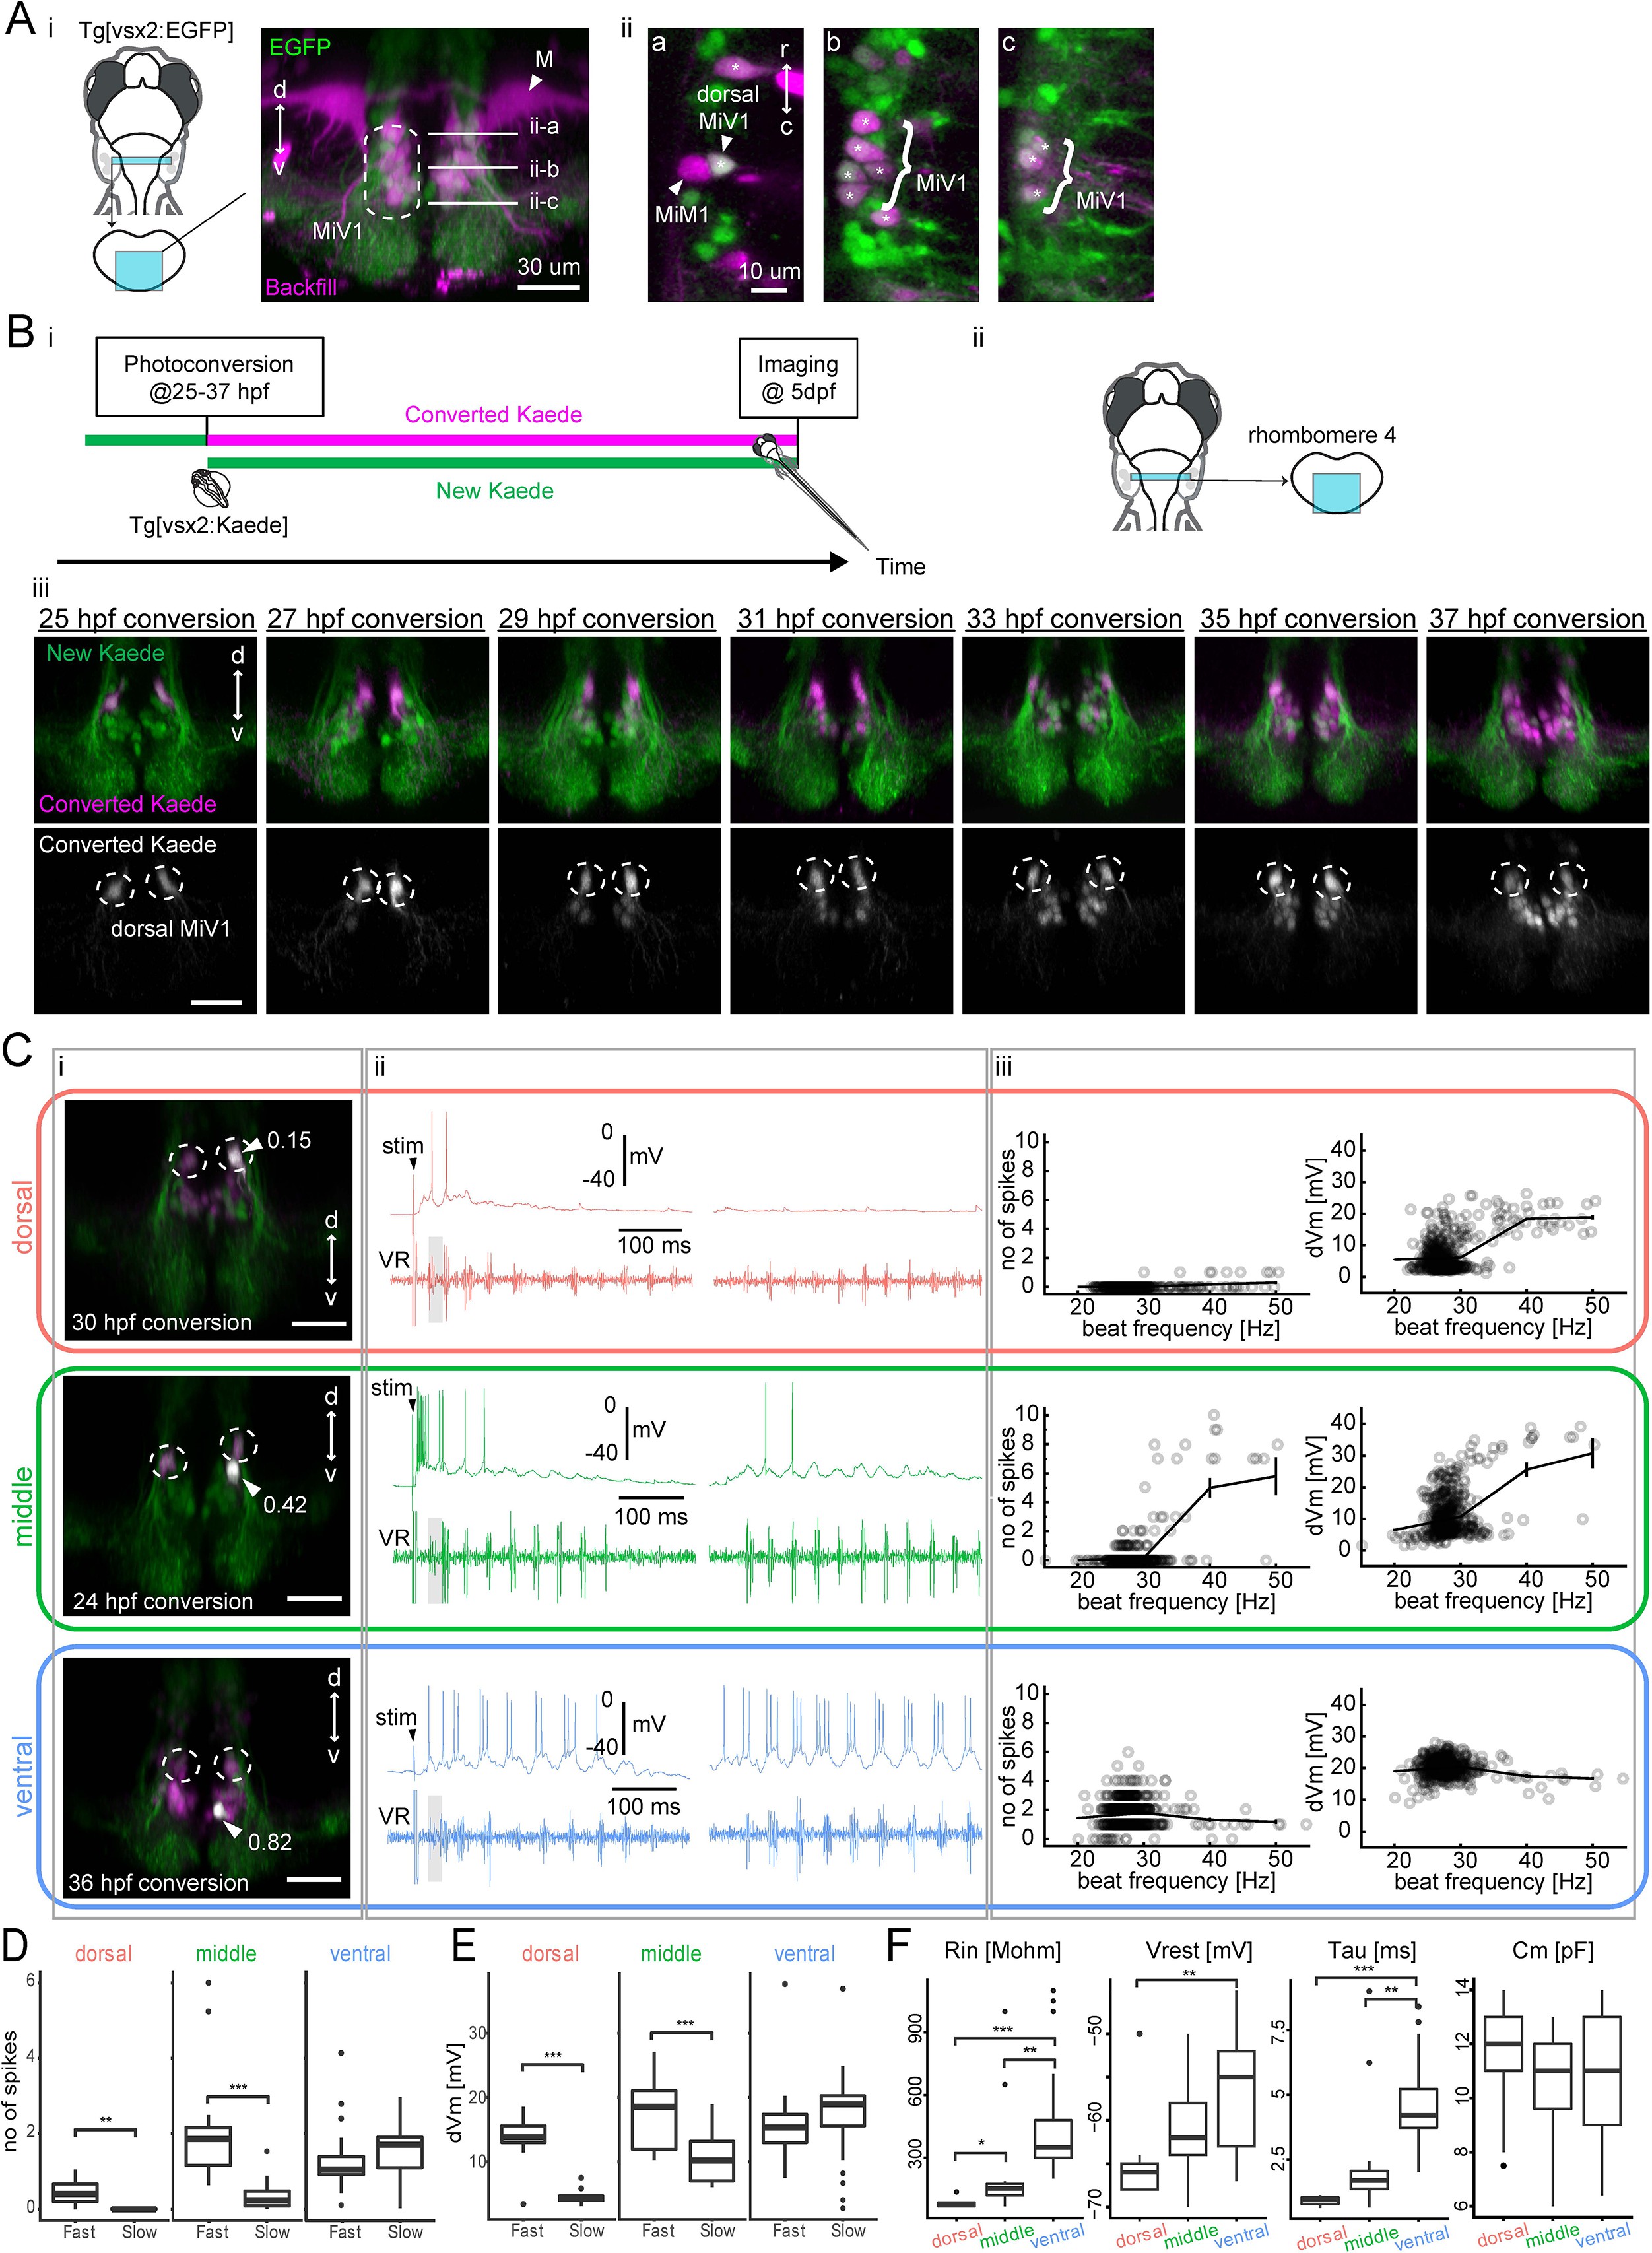
Fig. 7
Birthdating and electrophysiological analysis of V2a reticulospinal neurons in rhombomere 4.
(A) V2a reticulospinal (RS) neurons in rhombomere 4. (i) Coronal view of V2a reticulospinal neurons in the region of rhombomere four shown by the cyan patch (green, EGFP; magenta, backfill; d, dorsal; v, ventral). Mauthner cell (M) and MiV1 neurons are highlighted. White horizontal lines in the image indicate the optical slices shown in panel ii. (ii) Optical slices showing reticulospinal neurons at different depths indicated by white lines in i. Asterisks indicate backfilled V2a neurons. MiM1 and dorsal MiV1 are highlighted with arrowheads. Other more ventral MiV1s are highlighted with curly brackets. (B) Birthdate-related topographical organization of V2a RS neurons in rhombomere 4. (i) Experimental procedure (ii) Region displayed (cyan patch) (iii) Coronal views of V2a RS neurons in rhombomere 4 at five dpf showing Kaede photoconverted at a specific time point (25–37 hpf) in magenta in upper panels and gray in lower panels. Dotted circles indicate dorsal MiV1. (C) Whole-cell recordings of V2a reticulospinal neurons in rhombomere 4. Top orange row, an early-born dorsal V2a neuron (dorsal); Middle green row, an intermediate V2a neuron (middle); Bottom blue row, a late-born V2a neuron (ventral). (i) Coronal view of the patched cell (gray, white arrow). Green, unconverted Kaede. Magenta, converted Kaede. Dotted circles indicate dorsal MiV1. The number near the white arrowhead indicates normalized dorso-ventral position of the patched cell (see Materials and methods). (ii) Intracellular activity during shock-induced fast swimming (left) and spontaneous slow swimming (right). An arrowhead indicates the onset of the tail shock. VR, ventral root recording. Gray shaded boxes indicate similar fast beat frequencies. (iii) Number of spikes (left) and membrane depolarization (right) as a function of beat frequency. Open circles are raw data points. The solid line represents mean ± standard error from data binned at 10 Hz intervals. (D) Number of spikes per cycle during fast beat frequency (>35 Hz) and slow beat frequency (<35 Hz) for each age group (dorsal MiV1, n = 8; middle MiV1, n = 13; ventral MiV1, n = 23). Significant differences are indicated with asterisks (**p<0.01, ***p<0.001). (E) Membrane depolarization during fast swim (>35 Hz) and slow beat frequency (<35 Hz) for each age group (dorsal MiV1, n = 8; middle MiV1, n = 13; ventral MiV1, n = 23). Significant modulations based on beat frequency are indicated with asterisks (***p<0.001). (F) Intrinsic properties of each age group (dorsal MiV1, n = 8; middle MiV1, n = 13; ventral MiV1, n = 23). Rin, input resistance; Vrest, resting membrane potential; Tau, membrane time constant; Cm, membrane capacitance. Significant differences are indicated with asterisks (Dunn’s test, **p<0.01, ***p<0.001).