
Image
|
Figure Caption
Fig. 5-S1
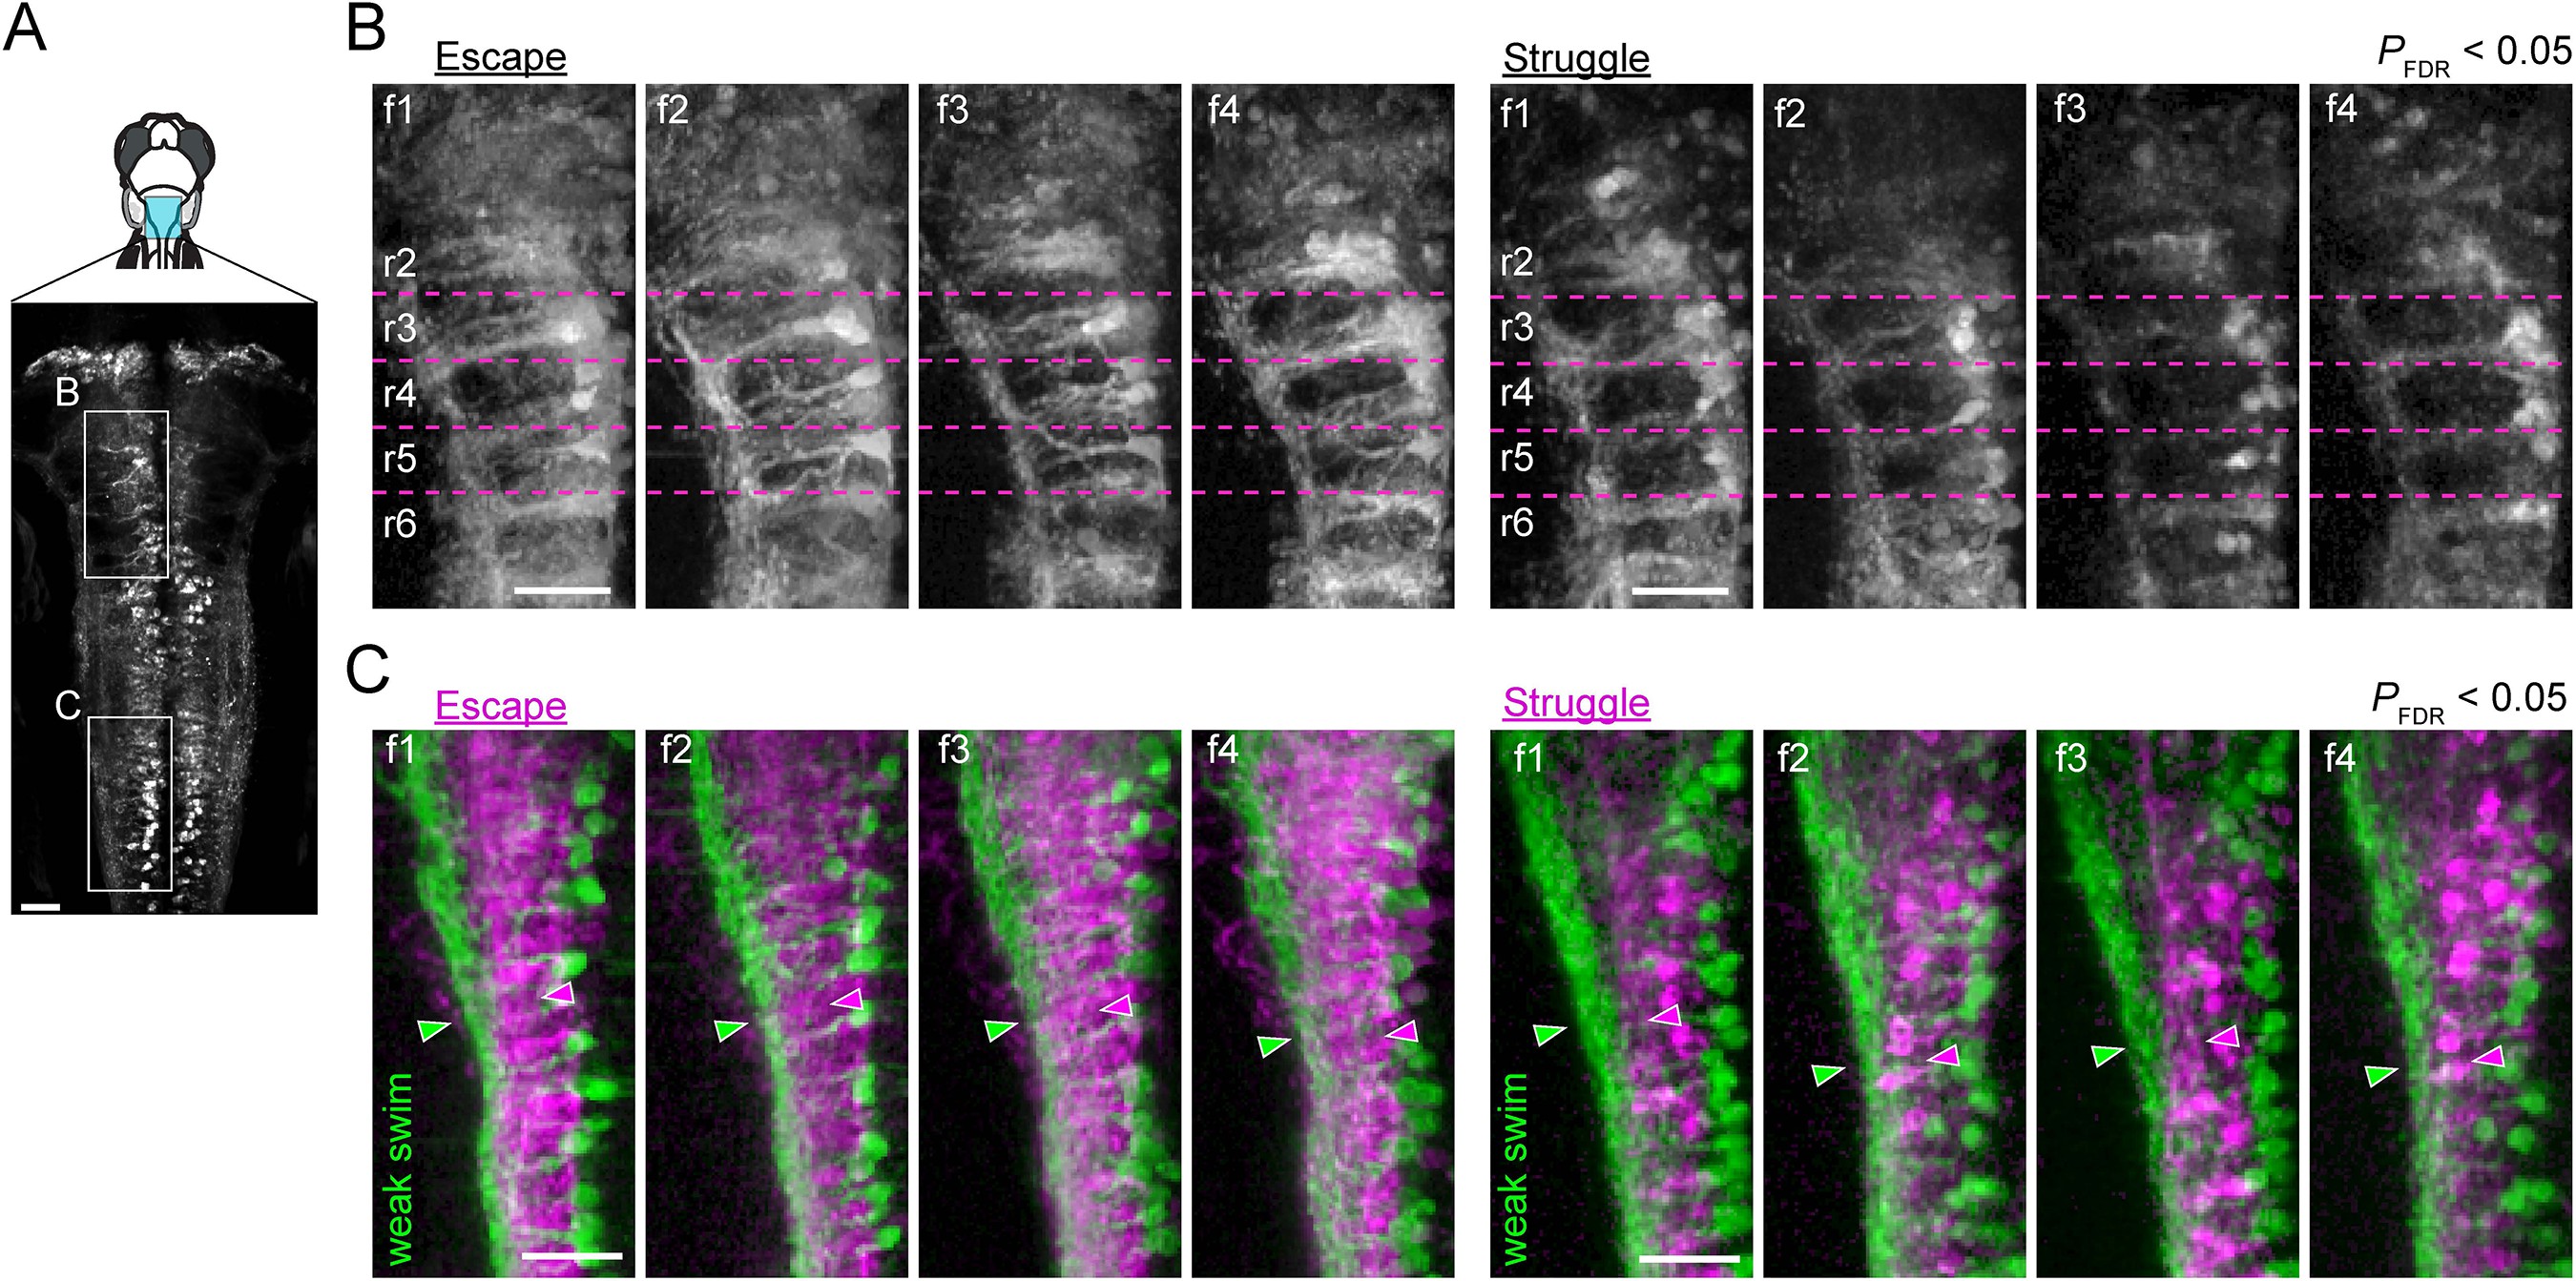
Activity maps from multiple subjects in the rostral and the caudal hindbrain.
(A) Regions displayed (cyan patch). (B) Activity maps in the rostral hindbrain from multiple fish (f1 to f4). Dotted magenta lines indicate the boundaries between hindbrain segments (rhombomere 2 (r2) to rhombomere 6 (r6)). More V2a neurons are recruited consistently for putative escape. (C) Activity maps in the caudal hindbrain from multiple subjects (f1 to f4). Arrowheads highlight the functional segregation of neuropil. Scale bars, 30 μm.
Acknowledgments
This image is the copyrighted work of the attributed author or publisher, and
ZFIN has permission only to display this image to its users.
Additional permissions should be obtained from the applicable author or publisher of the image.
Full text @ Elife