
|
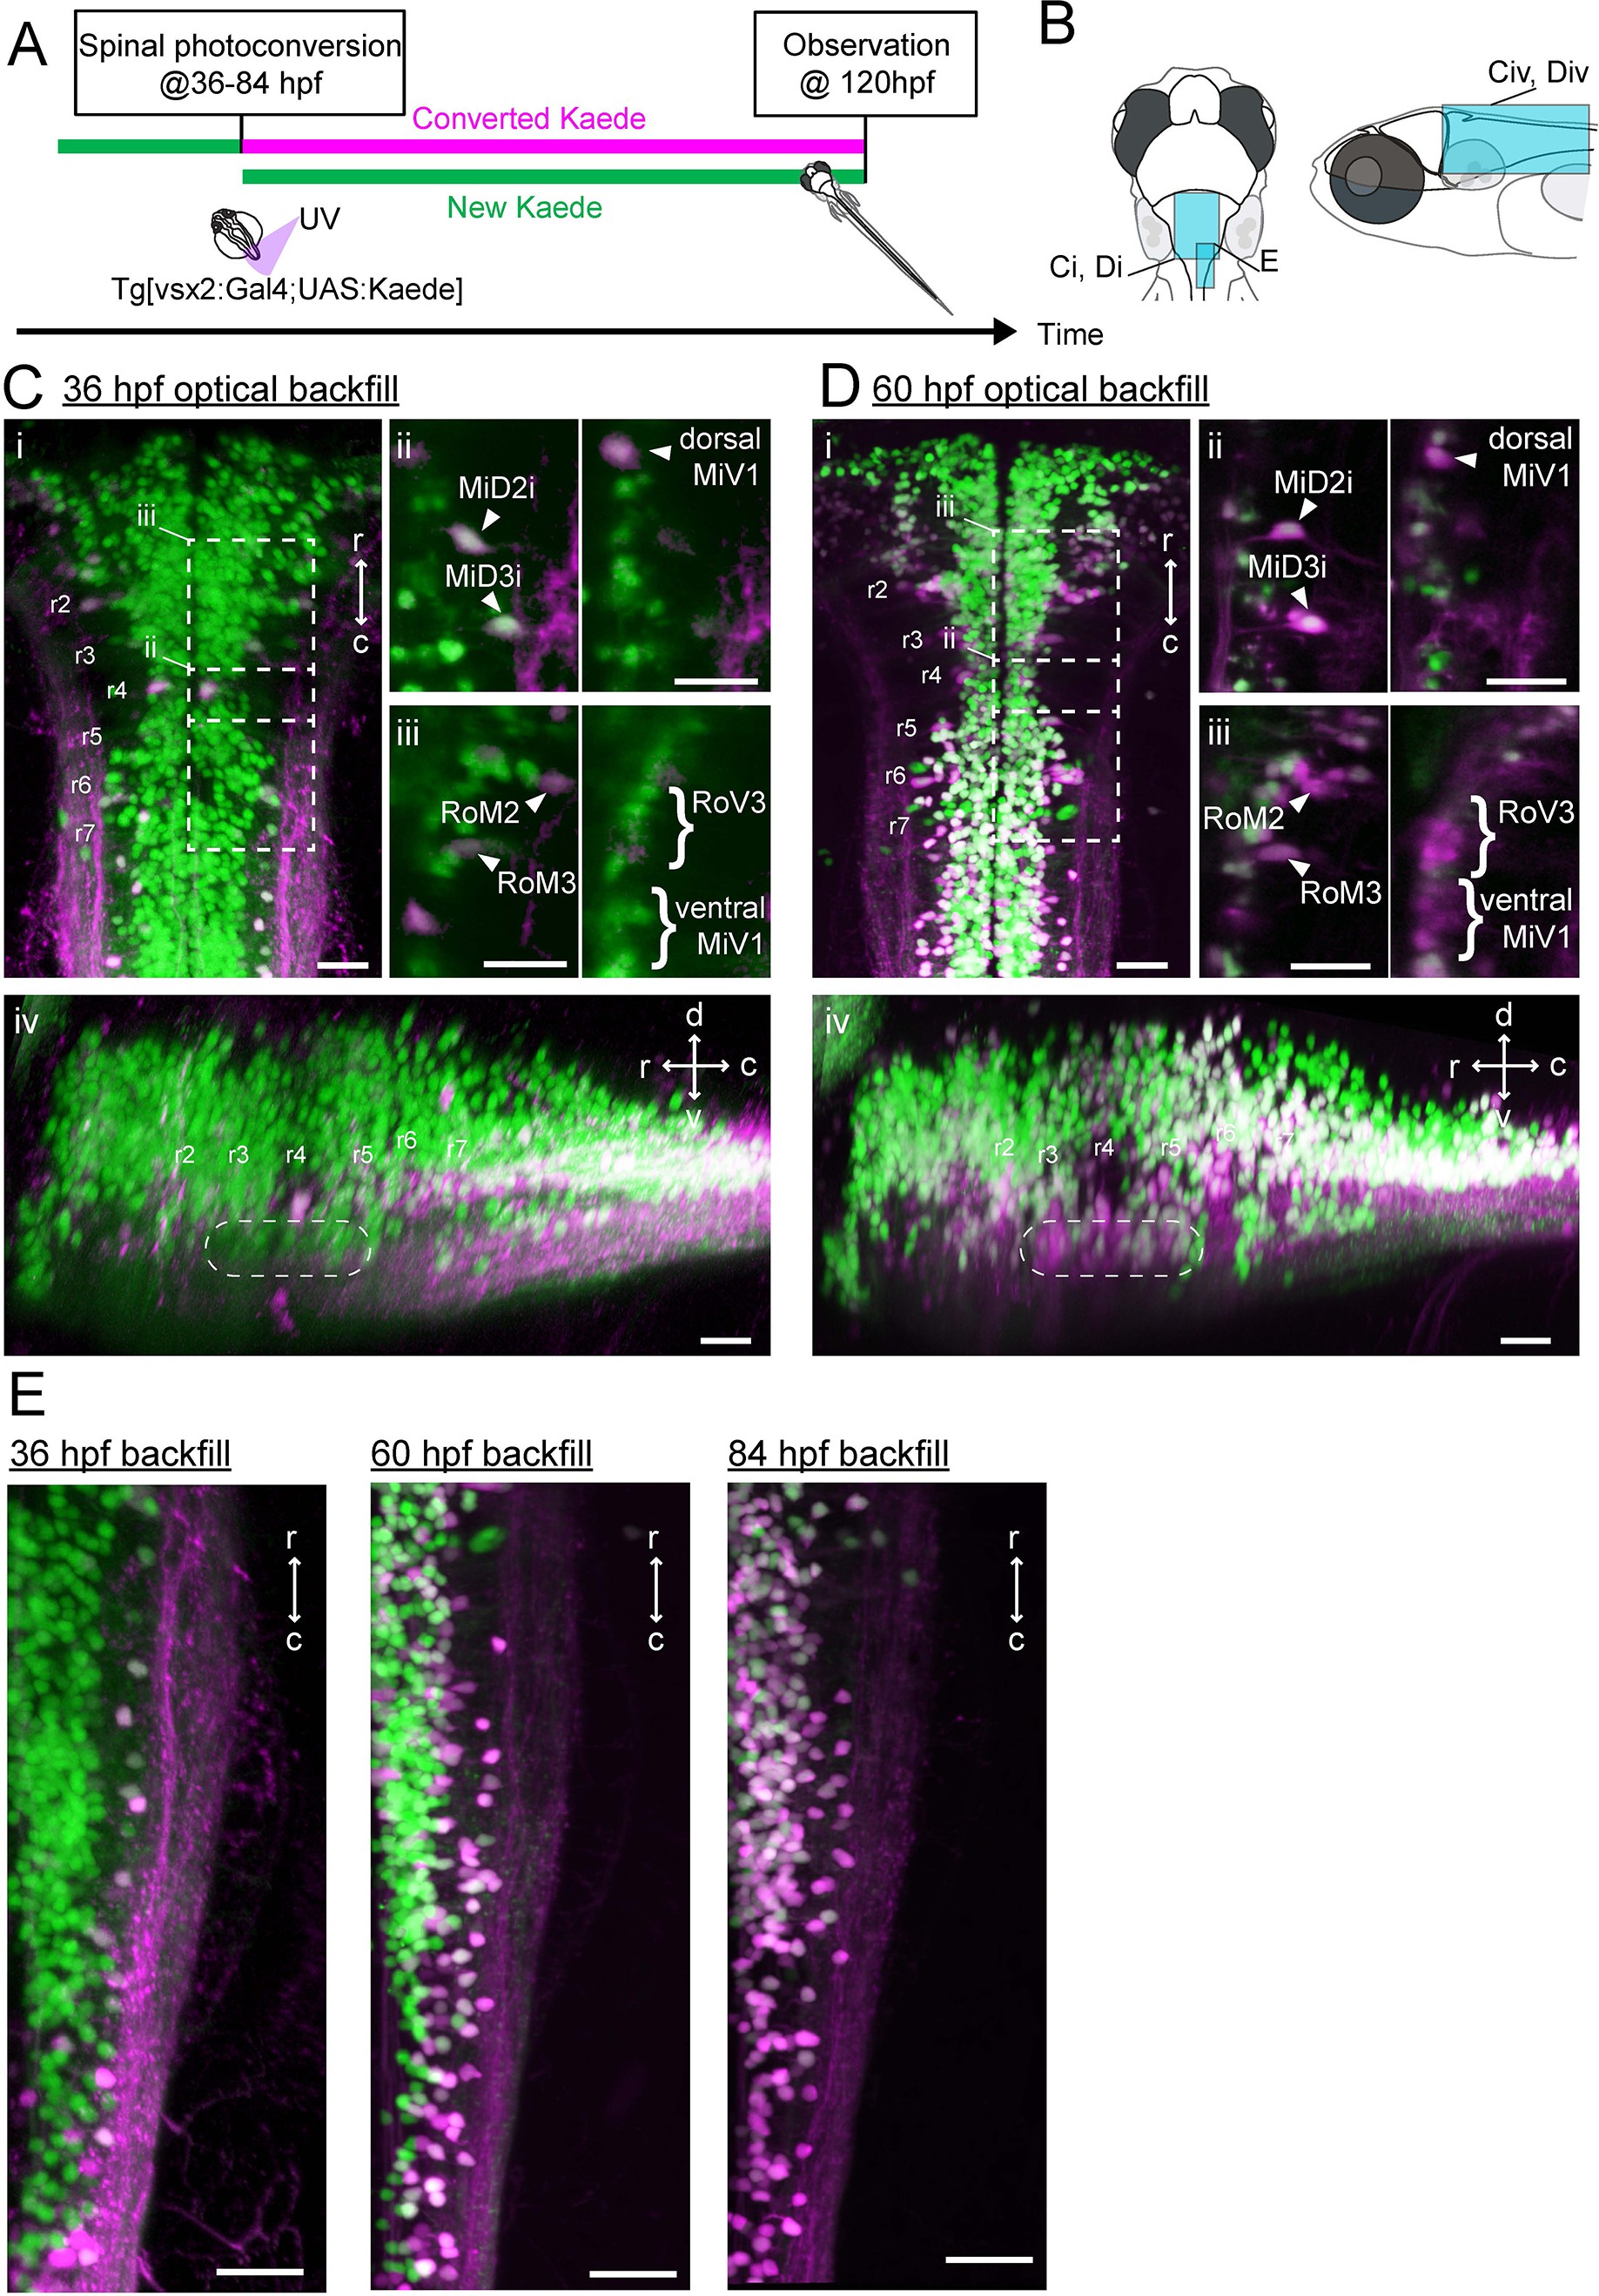
Fig. 3
Development of spinal projections of hindbrain V2a descending neurons.
(A) Experimental procedure. (B) Regions displayed. (C) Hindbrain V2a neurons optically backfilled from the rostral spinal cord at 36 hpf. Magenta, photoconverted Kaede; green, unconverted Kaede. (i) Dorsal view. Dotted rectangles indicate the locations of panels ii and iii. (ii) Optical slices showing caudal V2a reticulospinal neurons. (iii) Optical slices showing rostral V2a reticulospinal neurons (left panel, dorsal slice; right panel, ventral slice). (iv) Side-view. Dotted rounded rectangle indicates the position of ventral reticulospinal neurons. Hindbrain segments (r2 to r7) were identified based on V2a reticulospinal neurons. (D) Hindbrain V2a neurons optically backfilled from rostral spinal cord at 60 hpf. Photoconverted Kaede is shown in magenta and unconverted Kaede in green. (i) Dorsal view. Dotted rectangles indicate the locations of panels ii and iii. (ii) Optical slices showing caudal reticulospinal neurons. (iii) Optical slices showing rostral reticulospinal neurons (left panel, dorsal slice; right panel, ventral slice). (iv) Side-view. Dotted rounded rectangle indicates the location of ventral reticulospinal neurons. (E) Dorsal views of caudal hindbrain V2a neurons optically backfilled at 36, 60 and 84 hpf. r, rostral; c, caudal; d, dorsal; v, ventral; Scale bars, 30 μm.