
Fig. 9
- ID
- ZDB-FIG-190718-30
- Publication
- Pujala et al., 2019 - Chronology-based architecture of descending circuits that underlie the development of locomotor repertoire after birth
- Other Figures
- All Figure Page
- Back to All Figure Page
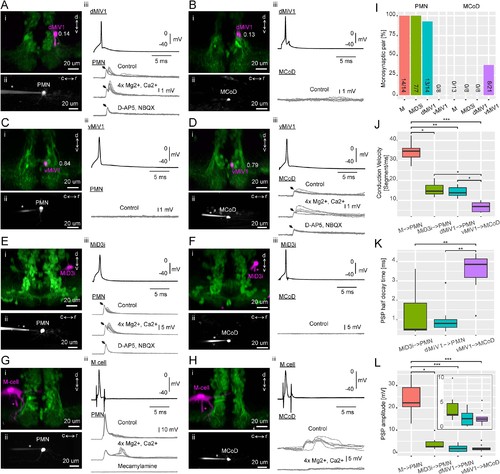
Synaptic connectivity of hindbrain V2a descending neurons.(A–H) Paired recordings of hindbrain neurons and spinal neurons. dMiV1, dorsal MiV1; vMiV1, ventral MiV1; M, Mauthner; PMN, primary motoneuron; MCoD, multipolar commissural neuron. (i) Coronal view of a patched hindbrain neuron (magenta) overlaid on V2a neurons (green). An asterisk indicates the patch pipette in use. The numbers in A-D indicate normalized dorsoventral position of patched MiV1 neurons. (ii) Side view of a patched spinal neuron (gray). (iii) Traces of postsynaptic potentials (PSPs) in a spinal neuron following spikes generated in a hindbrain neuron in control condition (top gray trace), in high divalent cation solution (middle gray trace) and following the blockade of chemical synapses (bottom gray trace). A black arrow highlights the putative electrical component of the postsynaptic potential. For simplicity, only one action potential trace is shown (top black trace). (I) Monosynaptic connections of hindbrain descending neurons to spinal neurons. Percentage of pairs showing monosynaptic connections to spinal neurons are shown. The number of connected pairs and the number of pairs examined are indicated at the bottom of each bar. The main effect of hindbrain cell types on the percentage of monosynaptic connection was significant (p<0.001). The main effect of spinal cell types was also significant (p<0.001). (J) Conduction velocity of monosynaptically connected pairs. Conduction velocity was defined as the number of muscle segments an action potential propagated in a millisecond. Box and whisker plots represent median (horizontal line across a box) as well as first and third quartiles. Asterisks mark significant differences between given connections (Dunn’s test, *p<0.05, **p<0.01, ***p<0.001). (K) Half decay time of monosynaptic PSPs. Data are presented as in J. (L) Amplitude of monosynaptic PSPs. Data are presented as J. (inset) Zoomed-in box and whisker plots for the pairs with smaller PSP. |