
- Title
-
Integrin α8 and Pcdh15 act as a complex to regulate cilia biogenesis in sensory cells
- Authors
- Goodman, L., Zallocchi, M.
- Source
- Full text @ J. Cell Sci.
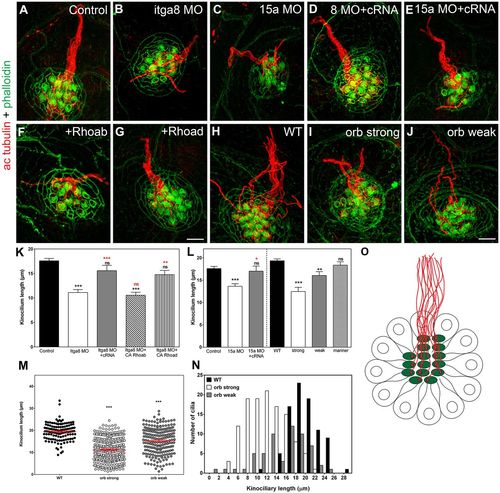
Downregulation or mutations of Itga8 or Pcdh15a inhibits ciliogenesis. (A–J) SR-SIM of 3 dpf (A–G) and 5 dpf (H–J) larvae immunostained for acetylated tubulin (ac tubulin, red) and counterstained with phalloidin (green). Control morpholino-injected animals (A), itga8 (Itga8 MO, B) or pcdh15a (15a MO, C) morphants, morphants co-injected with itga8 (8 MO+cRNA; D) or pcdh15a (15a MO+cRNA; E) cRNAs, Itga8 morphants co-injected with CA rhoab (+Rhoab; F) or rhoad (+Rhoad; G) cRNAs, WT (H), and orbiter (orb) strong (I) and orbiter weak mutants (J) are shown. Scale bars: 4 µm (A–G), 3.5 µm (H–J). (K,L) Quantification analysis of the kinociliary length. For each independent experiment, the average kinociliary length per neuromast was calculated and expressed as mean±s.e.m. (M) Scatter plot of individual kinociliary lengths for WT and orbiter mutants. (N) Frequency distribution analyses of kinociliary length in WT and orbiter mutants. (O) Cartoon of a neuromast (top view) showing the stained structures: hair bundle in green and kinocilia in red. **P<0.01; ***P<0.001; ns, not significant (one-way ANOVA followed by Dunnett's multiple comparisons test or two-tailed Student's t-test). At least five independent experiments were performed. EXPRESSION / LABELING:
PHENOTYPE:
|
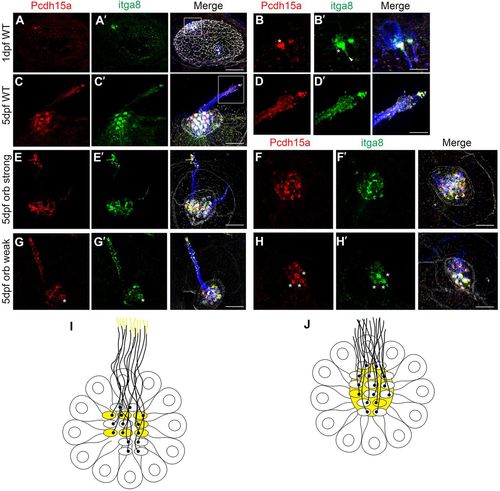
Itga8 and Pcdh15a localize at the apical aspect of hair cells. Representative images of embryos/larvae immunostained for Pcdh15a (red), Itga8 (green) and acetylated tubulin (blue). Samples were counterstained with phalloidin (gray). (A–B′) Confocal microscopy analyses of a 1 dpf zebrafish inner ear (dorsal view, anterior to the left). (B,B′) Magnification of boxed area in A,A′. (C–H′) SR-SIM of 5 dpf neuromasts. (C–D′) WT. (D,D′) Magnification of boxed area in C,C′. (E–F′) orbiter strong; (G–H′) orbiter weak. Asterisks denote hair bundle immunostaining. The arrowhead in panel B′ denotes cilia immunostaining. (I,J) Cartoons of neuromasts (top views) showing colocalization (yellow) of Itga8 and Pcdh15a. In WT animals (I), both proteins colocalize at the hair bundle in a sub-set of cells and towards the tip of the kinocilia. In mutant animals (J), there is some colocalization at the hair cell bundle but also around it (cuticular plate). Scale bars: 25 µm (A), 8 µm (B), 4 μm (D), 7 µm (C,E–H). Three independent experiments were performed. |
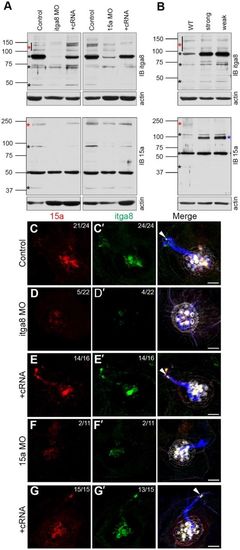
Interdependency of Itga8 and Pcdh15a protein expression and localization in hair cells. (A,B) Representative immunoblots from 3 dpf Pcdh15/Itga8 MOs (A) and 5 dpf pcdh15a mutants (B). (A) Expression of Itga8 and Pcdh15a was analyzed in controls, MOs (Itga8 MOs or 15a MOs) or MOs with the corresponding cRNA (+cRNA). (B) Expression of Itga8 and Pcdh15a was analyzed in WT and orbiter mutants. Red asterisks denote the full-length protein, black asterisks denote putative small protein variants. The blue asterisk denotes an additional variant not found in WT. Membranes were stripped and re-probed for actin as loading control. IB itga8, Itga8 immunoblot; IB 15a, Pcdh15a immunoblot. Three independent experiments were performed. (C–G′) Confocal images of 3 dpf controls (C,C′), MOs [Itga8 MOs or 15a MOs, (D,D′, F,F′) or MOs plus the corresponding cRNA (+cRNA; E,E′,G,G′)]. Larvae were immunostained for Pcdh15a (red), Itga8 (green) and acetylated tubulin (blue) and counterstained with phalloidin (gray). Arrowheads denote Itga8 and Pcdh15a colocalization at the tip of the cilia in controls and +cRNA MOs but not in MOs alone. Top right corner: number of neuromasts showing apical localization for the corresponding protein versus total number of neuromasts inspected. Two independent experiments were performed. Scale bars: 4.5 µm. EXPRESSION / LABELING:
PHENOTYPE:
|

Itga8 and Pcdh15a interact in hair cells. (A–D) Representative immunoblots of co-IP studies from 3 dpf larvae showing Itga8–Pcdhs15 interaction. IP itga8: Itga8 IP; IP NGpS: IP with pre-immune guinea pig serum; IP 15a, Pcdh15a IP; IP NRS, IP with pre-immune rabbit serum; IB 15a, Pcdh15a immunoblot; IB Itga8, Itga8 immunoblot. Asterisks denote specific bands (red asterisks, full-length protein; black asterisks, small variants). Three independent experiments were performed. (E–H) Coronal sections of 5 dpf WT (E,H) orbiter (orb) strong (F) and weak (G) mutants. Positive PLA (red dots) (E and high magnification inset), demonstrate an in situ Itga8–Pcdh15a association in WT but not in pcdh15a mutants (F,G). (H) Negative control in which one of the primary antibodies (in this case anti-Itga8) was omitted. Sections were immunostained for acetylated tubulin (blue) and counterstained with phalloidin (green). (I) Cartoon of a neuromast (lateral view) showing the stained structures: hair bundle in green, kinocilia and cell bodies in blue and the Itga8–Pcdh15a complex as red dots. Ten animals from two independent experiments were inspected. Scale bar: 6 µm (for E–H), 10 µm (inset in E). |
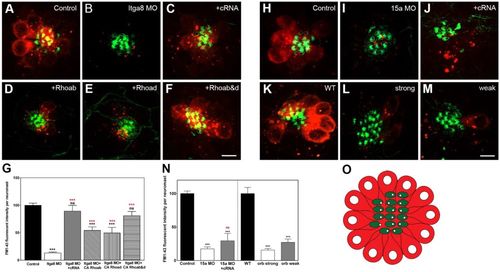
The Itga8–Pcdh15a complex regulates endocytosis/recycling in hair cells. (A–F,H–M) Confocal images of 3 dpf (A–F,H–J) and 5 dpf (K–M) larvae (labeled as in Fig. 1) incubated with FM1-43 for 30 min. Scale bars: 5.5 µm. (G,N) Quantification of total fluorescent intensity per neuromast. At least five independent experiments were performed for each treatment and total fluorescence intensity expressed as a percentage of that in control (mean±s.e.m.). (O) Cartoon of a neuromast (top view) showing the stained structures: hair cells loaded with FM1-43 are in red, and the hair cell bundle in green. **P<0.01; ***P<0.001; ns, not significant (one-way ANOVA followed by Dunnett's multiple comparisons test or two-tailed Student's t-test). PHENOTYPE:
|
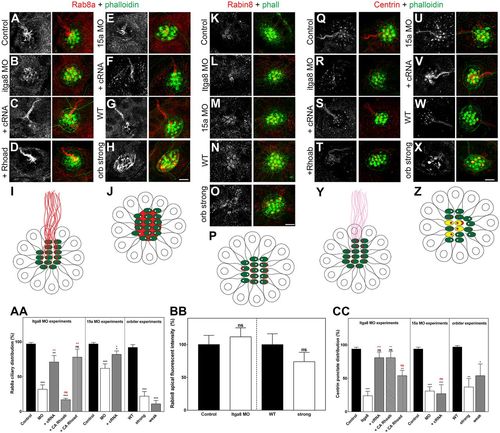
Lack of the Itga8–Pcdh15a complex activity results in ciliary cargo transport impairment. Confocal images and quantitative data (mean±s.e.m.) for Rab8a (A–H), Rabin8 (K–O) and centrin (Q–X) in control, Itga8 MOs, Pcdh15a MOs and orbiter mutants, and in rescued MOs (labeled as in Fig. 1). Scale bars: 6 µm. (I,J,P,Y,Z) Cartoons of neuromasts (top views) showing the corresponding staining: the hair cell bundle is in green, and Rab8a, Rabin8 or centrin is in red. (I) Control neuromast showing Rab8a ciliary staining. (J) Itga8- or Pcdh15a-deficient neuromast showing apical localization of Rab8a but no staining in the kinocilia. (P) Neuromasts showing apical distribution of Rabin8. (Y) Control neuromast showing basal body/transition zone localization of centrin with weak ciliary staining (pink). (Z) Itga8- or Pcdh15a-deficient neuromast showing centrin localization at the basal body/transition zone and also at the hair cell bundle (yellow). (AA) Rab8a graph. The presence of ciliary Rab8a was evaluated for each treatment in five independent experiments and expressed as percentage of that in control. (BB) Rabin8 graph. Neuromast apical fluorescence was quantified for each treatment in three independent experiments and is expressed as percentage of that in control. (CC) Centrin graph. The centrin punctate distribution correlating with the point of insertion of the kinocilium (basal body/centriole) was qualitatively assessed and the results expressed as percentages of that in control. Five independent experiments were performed. *P<0.05; **P<0.01; ***P<0.001; ns, not significant (one-way ANOVA followed by Dunnett's multiple comparisons test or two-tailed Student's t-test). |
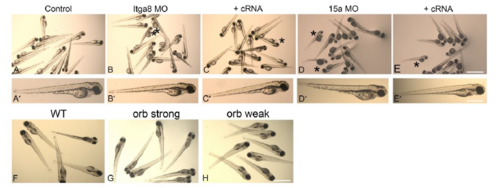
Body morphology analysis in morphants and mutants. Bright field microscopy images of larvae showing gross body morphology. A-A’: 3dpf control. B-B’: 3dpf Itga8 MOs. C-C’: 3dpf Itga8 MOs+itga8 cRNA. D-D’: 3dpf Pcdh15a MOs. E-E’: 3dpf Pcdh15a MOs+pcdh15a cRNA. F: 5dpf Wt. G: 5dpf orbiter strong. H: 5dpf orbiter weak Asterisks denote zebrafish with pericardial edema and slight body curvature. Scale: A-E: 300µm, A’-E’: 100µm. F-H: 200mm. |

Hair cell analysis in the MO and mutant animals. A: Number of cells per neuromast and the fraction of cells carrying cilium were quantified for each of the treatments (mean±SEM). One-way ANOVA followed by Dunnett’s multiple comparisons test was performed to compare number of cells per neuromast. Nonparametric Kruskal- Wallis test followed by Dunn’s multiple comparisons test was used to compare the proportion of ciliated hair cells. n: number of neuromast inspected from at least 3 independent experiments. ***p<0.001 versus WT. B-E: TUNEL labeling (red) of WT and orbiter neuromasts. Phalloidin (green) counterstained the hair cell bundle. WT+cp: Positive control: WT fish incubated with cisplatin. Scale: 4m. |

Ciliary localization analysis of Rhoa in Itga8/Pcdh15a MOs and mutants. A-J: Confocal images from 3dpf (A-G) and 5dpf (H-J) larvae showing Rhoa immunostaining (red) at the apical aspect of neuromast hair cells. Scale: A-G 5µm, H-J: 5.5µm. K-L: Quantification of Rhoa fluorescent intensity at the apical aspect of hair cells. At least 3 independent experiments were performed for each treatment and the total fluorescence intensity expressed as a percentage from control (mean±SEM). Oneway ANOVA followed by Dunnett’s multiple comparisons test or two-tailed Student’s t test ***p<0.001, **p<0.01, *p<0.05. ns=not significant. |
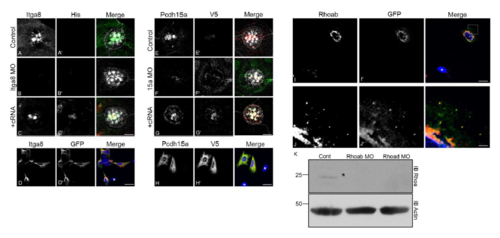
Qualification of the antibody preparations. A-D’: Guinea pig antibodies against an extracellular peptide sequence (REFESKPREVGRVYLY) of Itga8 were qualified in 3dpf MOs (A-C’) and HEK293 cells (D-D’). Confocal images of controls (AA’), itga8 MOs (B-B’) or itga8 MOs+cRNA coding for Itga8-His (C-C’), showing immunostaining for Itga8 and His6x. D-D’: Confocal images of HEK293 transiently electroporated with Itga8-GFP and immunostained with anti-Itga8 and anti-GFP. E-H’: Rabbit antibodies against a carboxyl-terminal peptide (KNSDRFGCSPDVKYDNKNDV) of Pcdh15a (Pcdh15a-CD1) were qualified in 3dpf larvae (E-G’) and HeLa cells (H-H’). Confocal images of controls (E-E’), pcdh15a MOs (F-F’) or pcdh15a MOs+cRNA coding for Pcdh15a-V5 (G-G’) showing immunostaining for Pcdh15a and V5 epitope. H-H’: Confocal images of HeLa cells transiently electroporated with Pcdh15a-V5 and immunostained with anti-Pcdh15a and anti-V5. I-J’: Mouse monoclonal antibodies against a peptide sequence common to both Rhoa proteins (VADIEVDSKQVELAC) were qualified in HeLa cells transiently electroporated with Rhoab-GFP. Confocal images showing immunostaining with anti-Rhoa and anti-GFP. J-J’: High magnification of the boxed area in I-I’, showing positive perinuclear and vesicular immunostaining. Similar results were obtained with Rhoad-GFP (data not shown). A-C’, E-G’: hair cells were counterstained with phalloidin (merged images). D-D’, H-H’, I-I’: DAPI was used to counterstain the nucleus. Asterisks denote untransfected cells used as control. Scale:A-C’, E-G’: 5.5µm; D-D’, H-H’: 19.5µm; I-I’: 17µm; J-J’: 2.5µm. K: Rhoa immunoblot of 3dpf controls, Rhoab MOs (5.7ng) and Rhoad MOs (8ng). Asterisk denotes specific band. Membrane was stripped and blotted for actin as a loading control. At least three independent experiments were performed with the morphants and at least two independent experiments with the cell cultures. Re-localization (and re-expression) of the Itga8 or Pcdh15a proteins in the MOs coinjected with the full length cRNA, was confirmed by co-labeling with the corresponding antibody and anti-tag antibodies (anti-His for Itga8 and anti-V5 for Pcdh15a), demonstrating the specificity of the knockdown and also, precluding the possibility of interference between the morpholino suspension and the cRNA as it has been suggested by Kok et al. (2015). |

Iga8/Pcdh15a complex regulates ciliogenesis in hTERT-RPE cells. A: Immunoblots of untransfected (WT) and co-transfected cells with Itga8 and Pcdh15a (Itga8 + 15a). WT cells do not express human Itga8 or Pcdh15a, corroborated by RTPCR and western blot analysis (data not shown). Membranes were stripped and reprobed for actin as loading control. B-E: Immunofluorescence of untransfected (B) or co-transfected (C-E) cells. Cells were co-immunostained for Itga8 (magenta), Pcdh15a (green) and acetylated tubulin (red). Asterisk denotes another cilia positive for Itga8 and Pcdh15a. D: Magnification of the boxed area in C. E: Channel shifted image of D. B-C: 10µm, D-E: 1µm. F: Ciliary length averages from three independent experiments in untransfected cells, Itga8 transfected cells, Pcdh15a transfected cells and cotransfected cells. In the case of transfected cells, measurements were performed in cilia that were positive for Itga8, Pcdh15a or both accordingly. One-way ANOVA followed by Dunnett’s multiple comparisons test. ***p<0.001 versus control. |

Endocytosis/recycling is blocked in Itga8 MOs and Pcdh15a MOs and mutants. Confocal images (A-G) and quantitative analysis (H-I) of 3dpf (A-D) and 5dpf (E-G) animals incubated for 30-90 min with FM1-43 (red). Phalloidin (green) was used to counterstain the hair cell bundle. H-I: Quantification of total fluorescent intensity per neuromast expressed as a percentage from control (mean±SEM). At least five independent experiments were performed. One-way ANOVA followed by Dunnett’s multiple comparisons test or two-tailed Student’s t test ***p<0.001, **p<0.01, *p<0.05. ns=not significant. J-O: Analysis of FM1-43 uptake after 30 min incubation in superficial J. Cell Sci. 130: doi:10.1242/jcs.206201: Supplementary information Journal of Cell Science • Supplementary information cells from controls (J, M), MOs (K-L) and pcdh15a mutants (N-O). n=neuromast. Scale: A-D: 6µm; E-G: 11µm; J-O: 35µm. |
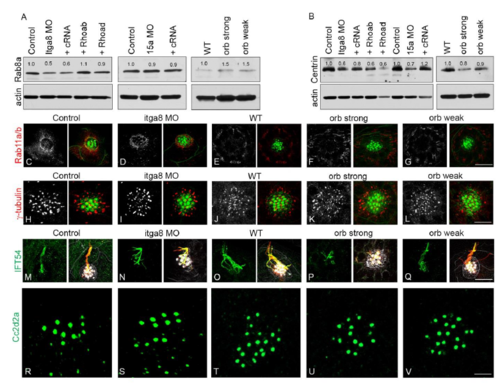
Analysis of ciliary markers in MOs and mutants. Representative immunoblots for Rab8a (A) and centrin (B) in the different experimental animals. Blots were stripped and re-probed for actin that was used as a loading control for quantification of the corresponding bands (numbers on top each band). C-G: Confocal images of the recycling endosome marker Rab11a/b (red). H-L: Confocal images of the basal body marker -tubulin (red). M-Q: Confocal images of the ciliary protein IFT54 (green). R-V: Confocal images of the transition zone associated protein Cc2d2a (green). Acetylated tubulin was used as an axoneme marker (red). Phalloidin was used to counterstain the hair cell bundle. Scale: C-G: 15µm; H-L: 9µm, M-Q: 11µm, R-V: 2.5µm. |