
FIGURE
Fig. s1
Fig. s1
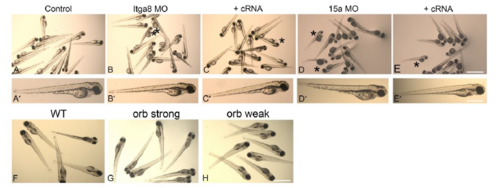
Body morphology analysis in morphants and mutants. Bright field microscopy images of larvae showing gross body morphology. A-A’: 3dpf control. B-B’: 3dpf Itga8 MOs. C-C’: 3dpf Itga8 MOs+itga8 cRNA. D-D’: 3dpf Pcdh15a MOs. E-E’: 3dpf Pcdh15a MOs+pcdh15a cRNA. F: 5dpf Wt. G: 5dpf orbiter strong. H: 5dpf orbiter weak Asterisks denote zebrafish with pericardial edema and slight body curvature. Scale: A-E: 300µm, A’-E’: 100µm. F-H: 200mm. |
Expression Data
Expression Detail
Antibody Labeling
Phenotype Data
Phenotype Detail
Acknowledgments
This image is the copyrighted work of the attributed author or publisher, and
ZFIN has permission only to display this image to its users.
Additional permissions should be obtained from the applicable author or publisher of the image.
Full text @ J. Cell Sci.