
Fig. 1
- ID
- ZDB-IMAGE-180327-17
- Antibodies
- Publication
- Goodman et al., 2017 - Integrin α8 and Pcdh15 act as a complex to regulate cilia biogenesis in sensory cells
- All Figures
- Figures for Goodman et al., 2017
|
Fig. 1
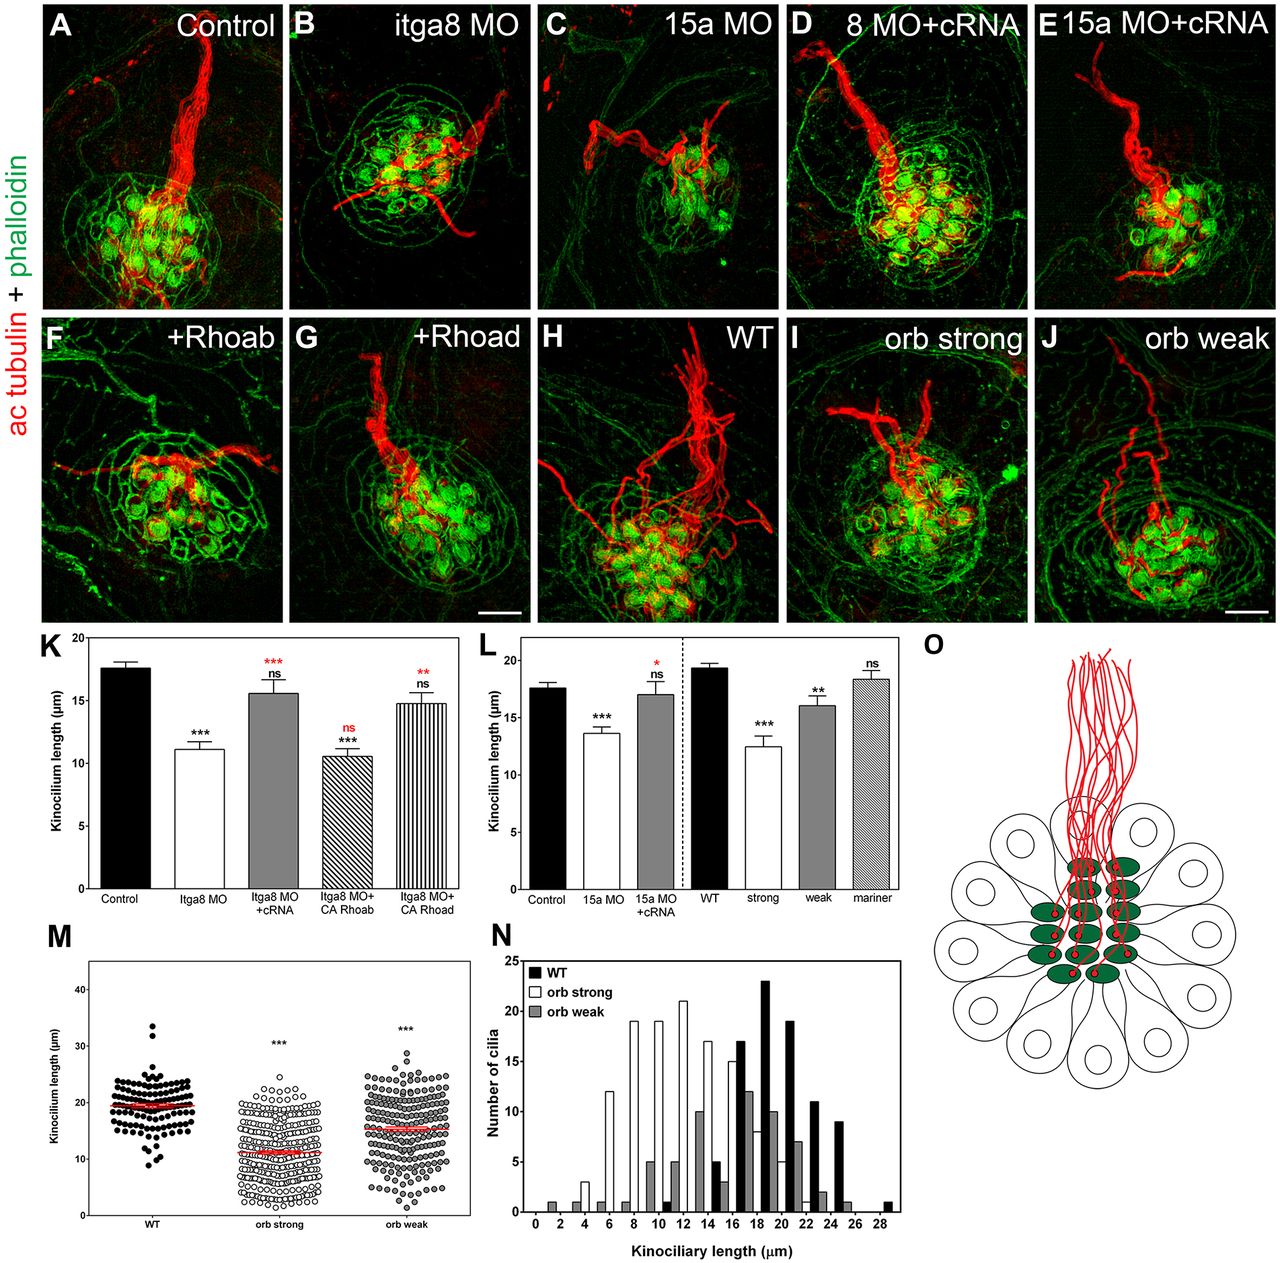
Downregulation or mutations of Itga8 or Pcdh15a inhibits ciliogenesis. (A–J) SR-SIM of 3 dpf (A–G) and 5 dpf (H–J) larvae immunostained for acetylated tubulin (ac tubulin, red) and counterstained with phalloidin (green). Control morpholino-injected animals (A), itga8 (Itga8 MO, B) or pcdh15a (15a MO, C) morphants, morphants co-injected with itga8 (8 MO+cRNA; D) or pcdh15a (15a MO+cRNA; E) cRNAs, Itga8 morphants co-injected with CA rhoab (+Rhoab; F) or rhoad (+Rhoad; G) cRNAs, WT (H), and orbiter (orb) strong (I) and orbiter weak mutants (J) are shown. Scale bars: 4 µm (A–G), 3.5 µm (H–J). (K,L) Quantification analysis of the kinociliary length. For each independent experiment, the average kinociliary length per neuromast was calculated and expressed as mean±s.e.m. (M) Scatter plot of individual kinociliary lengths for WT and orbiter mutants. (N) Frequency distribution analyses of kinociliary length in WT and orbiter mutants. (O) Cartoon of a neuromast (top view) showing the stained structures: hair bundle in green and kinocilia in red. **P<0.01; ***P<0.001; ns, not significant (one-way ANOVA followed by Dunnett's multiple comparisons test or two-tailed Student's t-test). At least five independent experiments were performed.